About Me

Born and raised in the mountains of Colorado, I came to appreciate the beauty found in the mountains that surrounded me and developed a sense of adventure and curiosity from a young age. That curiosity grew as I traveled to many places with my parents. These experiences instilled in me a fresh perspective of what surrounded me and a desire to learn about the new places, peoples, cultures, and landscapes I encountered. While deciding on a major for my undergraduate degree, I attended a study abroad to Tanzania with the Geography Department. That experience enriched my perspective and increased my desire to learn even more. Upon returning home, I declared Geography as a major and have never looked back since. I had a goal to find something that I enjoyed doing to pursue for a career. With GIS, I achieved that goal. I love what I do from getting to create and design maps on many different topics to visualizing and solving problems from a spatial perspective.
My focus in my work is to help others see the world from a new perspective, inspire others to learn more about the world around them, and tell the stories that surround us. I do this by creating maps, applications, and presentations using tools such as ArcGIS Pro, Adobe Illustrator, StoryMaps for ArcGIS, and JavaScript mapping libraries like Mapbox GL JS & ArcGIS Maps SDK for JavaScript. Discovering GIS has been a blessing I never knew I needed, and with it, I have found my true passion in life.
Highlighted Work
Academic Work
(in alphabetical order by title)
CUWCD Pipeline COF Scoring Application
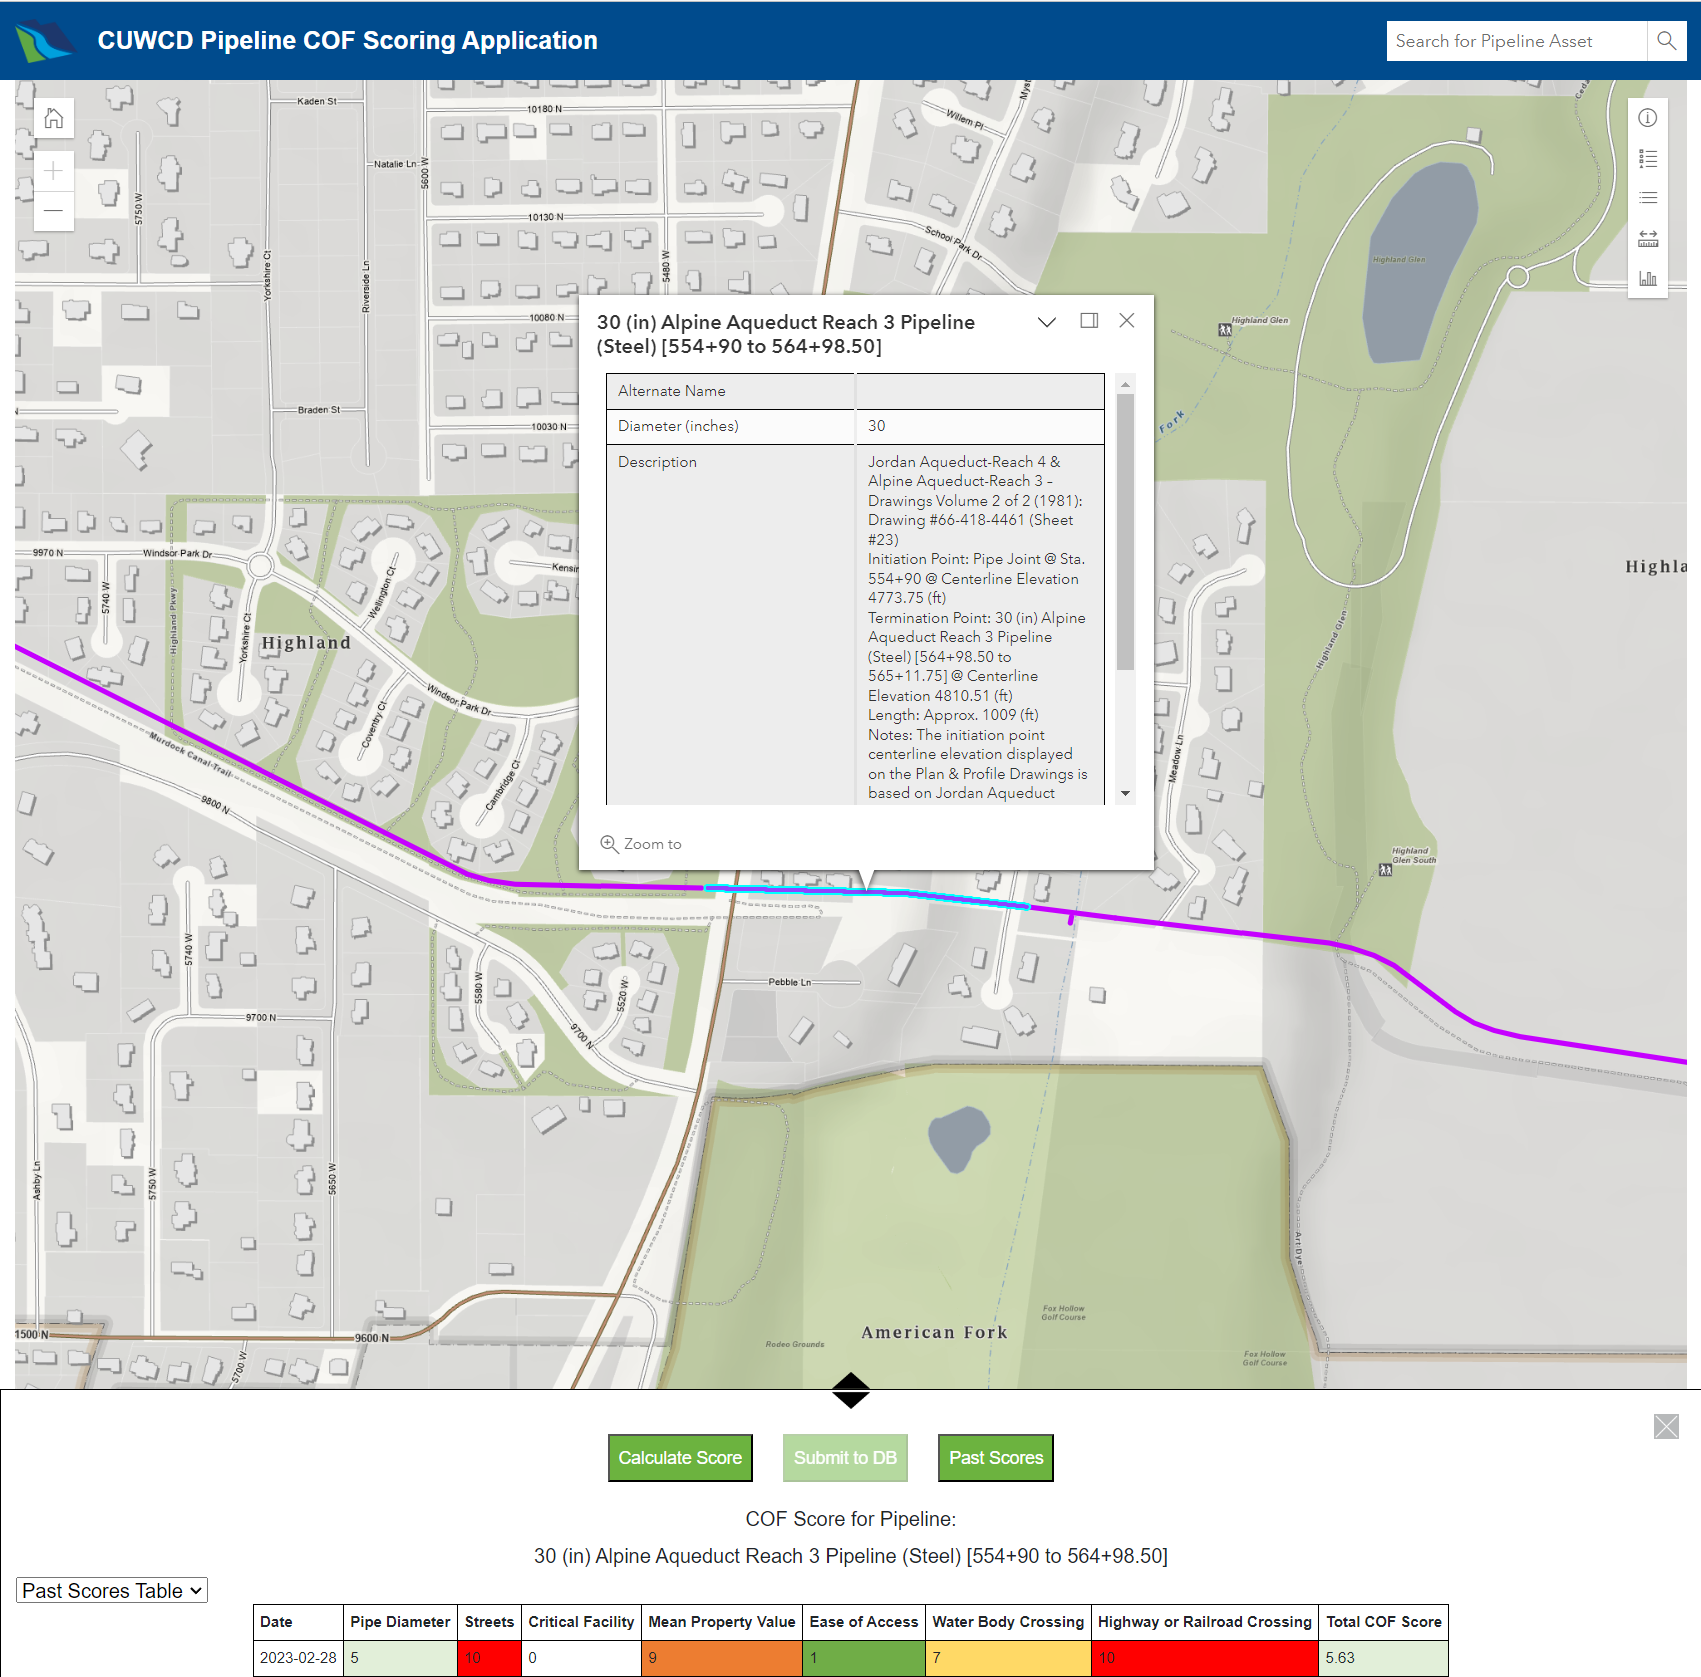
Tools: ArcGIS Maps SDK for JavaScript, D3, jQuery UI, Bootstrap, ASP.NET Core (C#)
Course: GEOG 778 - Practicum in GIS Development (UW-Madison)
Project Background: This interactive web application was my culminating final project for the Master's in GIS Development degree from UW-Madison. I designed it for the Central Utah Water Conservancy District (CUWCD) to evaluate the consequence of failure (COF) for their pipelines. COF considers the potential impacts that would occur if a pipe failure occurred and is scored by evaluating the spatial relationships between a pipeline and surrounding features (e.g., distances to nearby roads). As such, this interactive web map application, is designed to calculate COF scores for CUWCD pipelines using methods that evaluate the spatial relationships between a selected pipeline and nearby features, write those scores to the PostgreSQL database through the use of API calls (POST) to a controller-based web API written in C# on the hosting server, and view the scores in tables and charts for comparison to help determine pipeline replacement schedules.
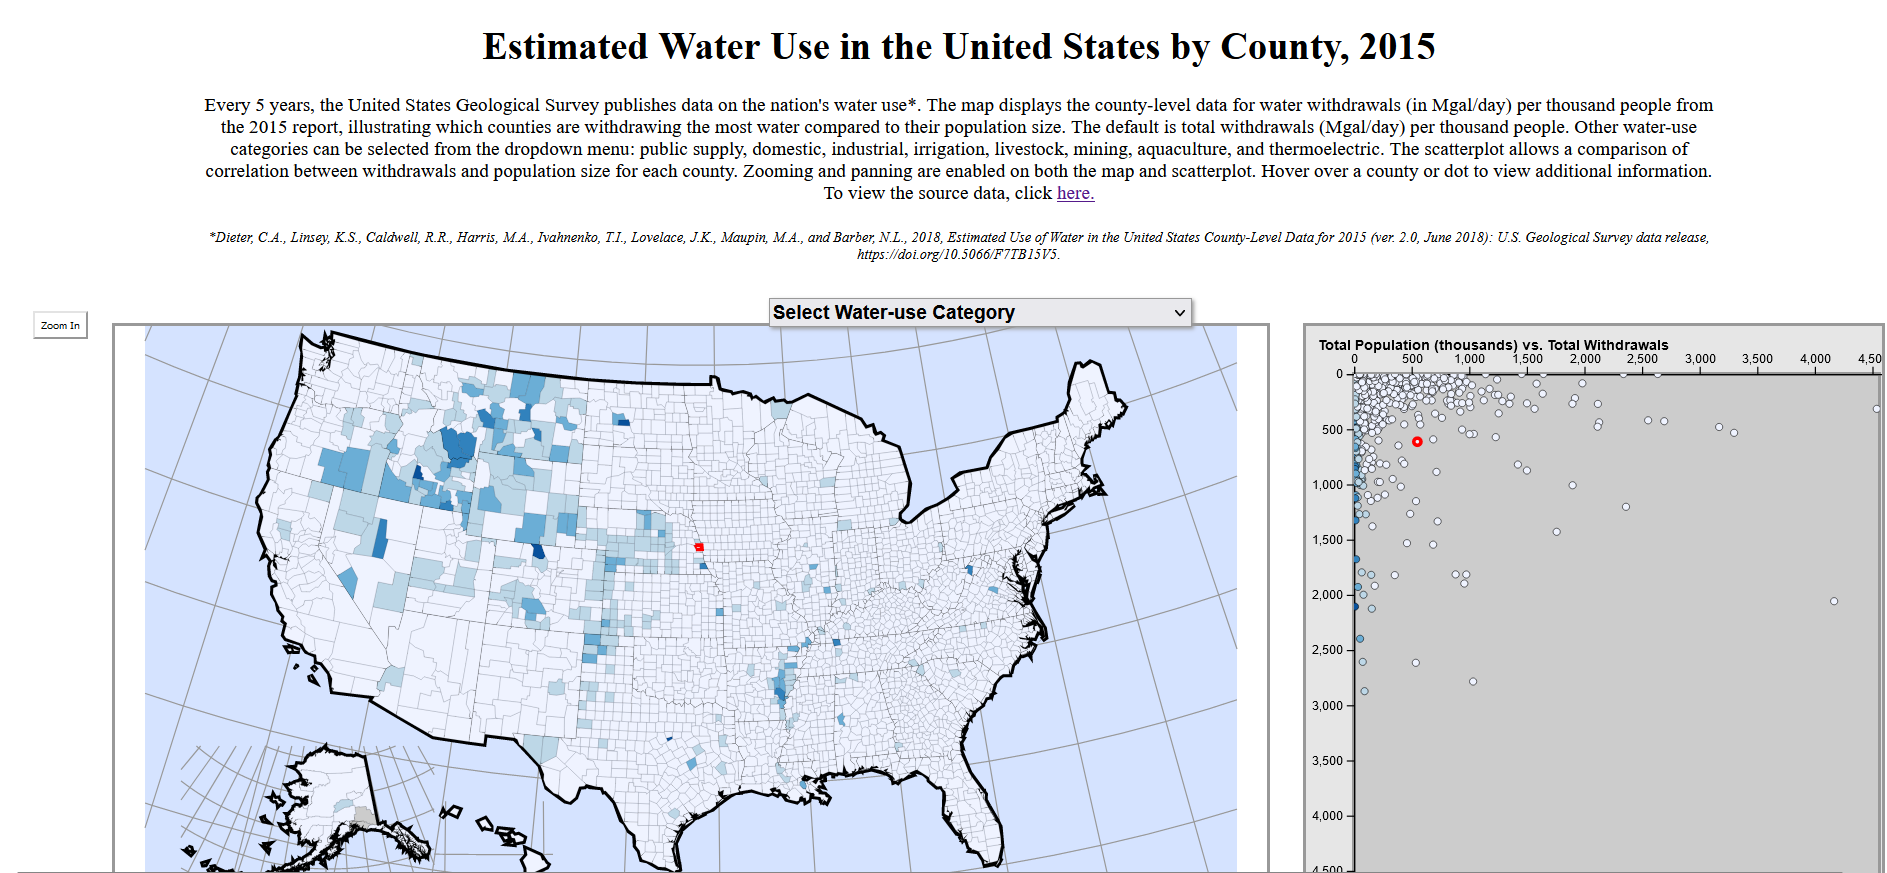
Estimated Water Use in the United States by County Application
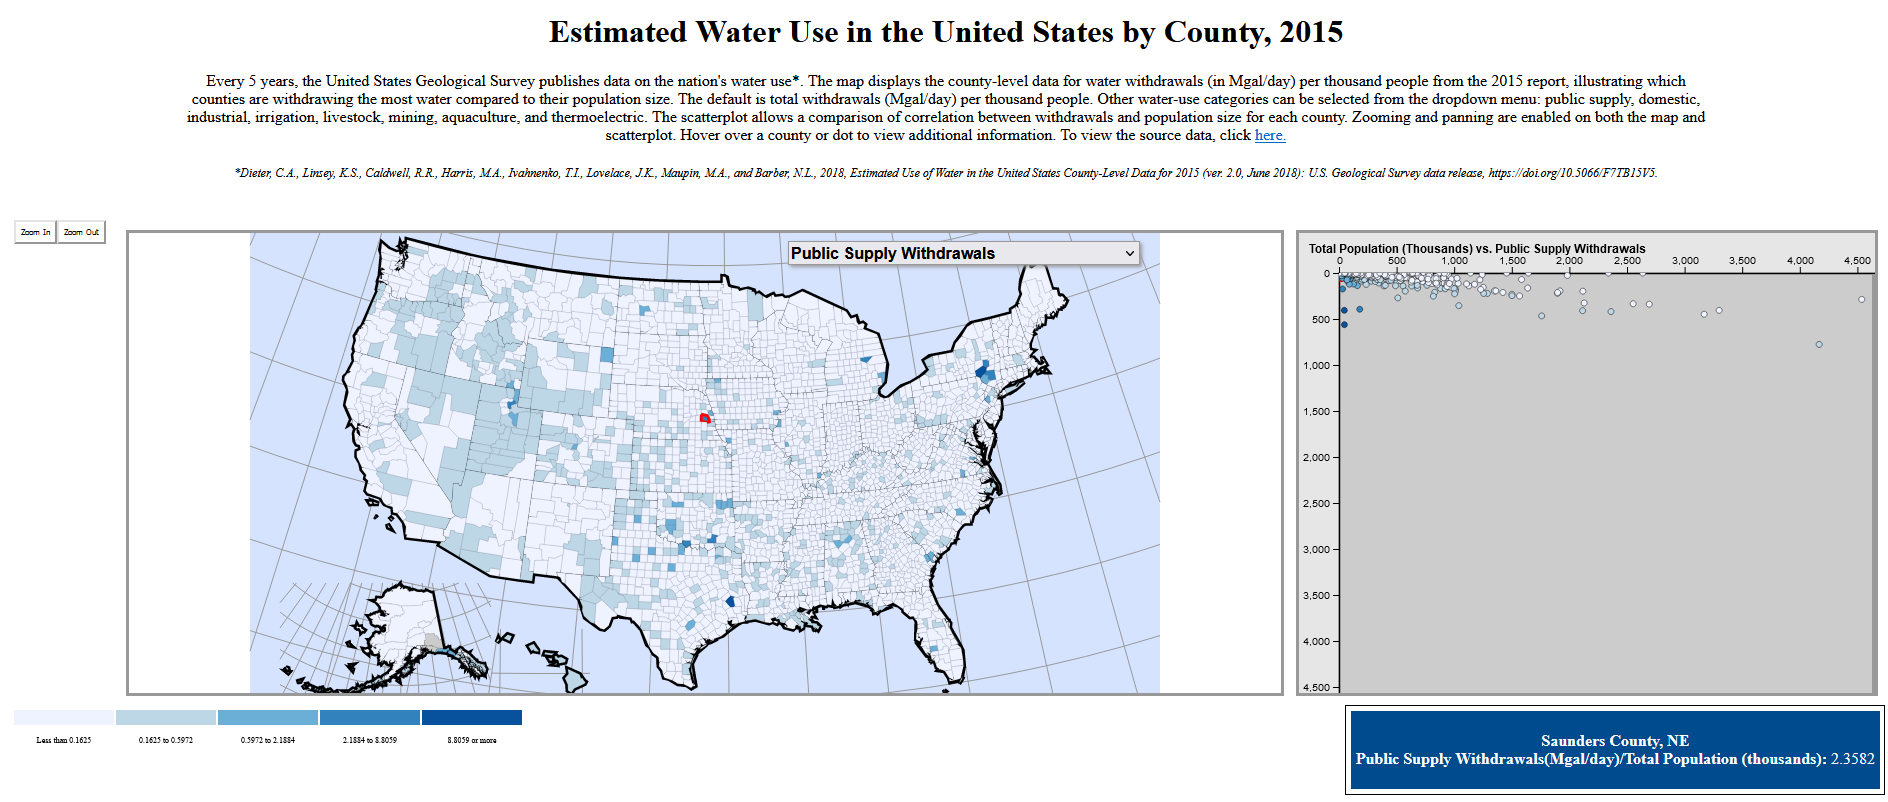
Tools: D3, JavaScript, jQuery, GitHub
Course: GEOG 575 - Interactive Cartography & Geovisualization (UW-Madison)
Project Background: The goal of this project was to create an interactive web page utilizing coordinated visualization with a choropleth map and chart to generate meaningful insights regarding patterns in the data set. My project focused on looking at different types of water use in the United States by counties. The interactive operators of reexpress (the type of water use variable being displayed in the map and chart can be changed by the user) and retrieve with coordinated visualization (selecting a point in the scatterplot or county in the map highlights the associated point/county in the other with information for that county) were used to allow the user to be able to view the patterns across the map and scatterplot for the water use variable of interest.
Exploring Grand Teton National Park (GTNP) Application
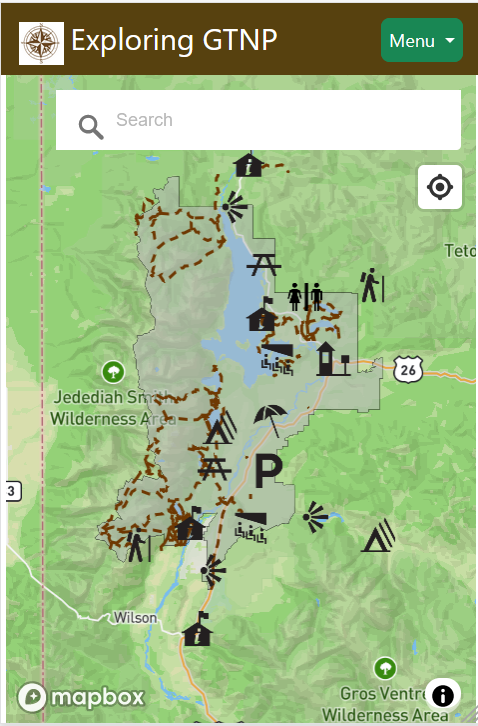
Tools: Mapbox, Bootstrap, D3, JavaScript, GitHub
Course: GEOG 777 - Capstone in GIS Development (UW-Madison)
Project Background: In the course, we were given a challenge to design a mobile-friendly application for a park with a user-contributed layer. I designed this mobile-friendly web application for first-time visitors to Grand Teton National Park. In the application, the user can select different points of interest in the map to find out more information, search for and get directions to places, see their current location in the map, and filter the points displayed in the map. The application also allows users to contribute to one of the data layers by ranking their favorite point of interest using a form which then uses API calls on form submission for inserting the new data (PUT) and retrieving the updated data (GET) from the data layers stored in Mapbox. I had to consider aspects of design to make the application work well on mobile devices.
Exploring the Spatial Relationship Between Cancer and Nitrate Application
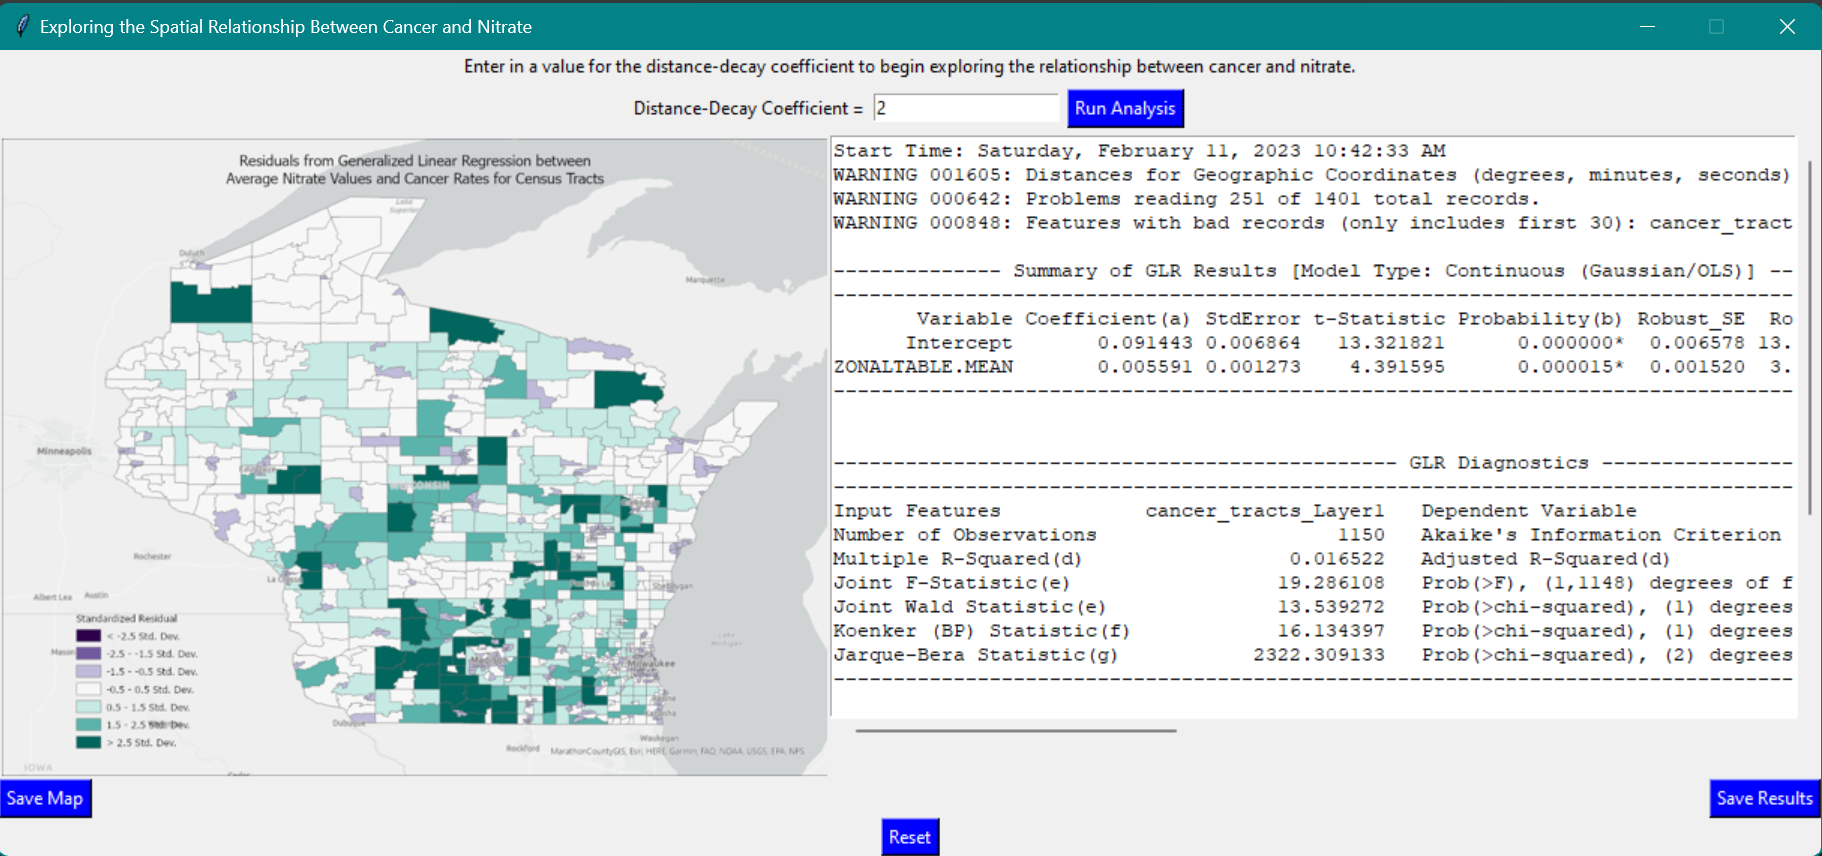
Tools: Python, Arcpy, Tkinter
Course: GEOG 777 - Capstone in GIS Development (UW-Madison)
Project Background: In the course, we were given a challenge to design an application that would perform spatial analysis methods based on user input to examine the relationship between cancer rates and nitrate levels in the state of Wisconsin. Building the application required that I utilize what I had learned regarding python from the Introduction to Geocomputing (GEOG 378) course and spatial analysis from the GIS & Spatial Analysis (GEOG 579) course at UW-Madison. For the application, I leveraged the library of Arcpy for the spatial analysis and the library of Tkinter for the GUI. The spatial analysis methods of IDW > Zonal Statistics > Add Join > Generalized Linear Regression were used. In the GUI, the user inputs different values for the distance decay coefficient used in the IDW step of the analysis. Then, the analyses gets run and the end results from the Generalized Linear Regression analysis (a resulting standard deviation map, linear regression equation, and statistical test values) are output to the GUI for the user to evaluate and save the results.
Grand Teton Lodge Company Guests Application
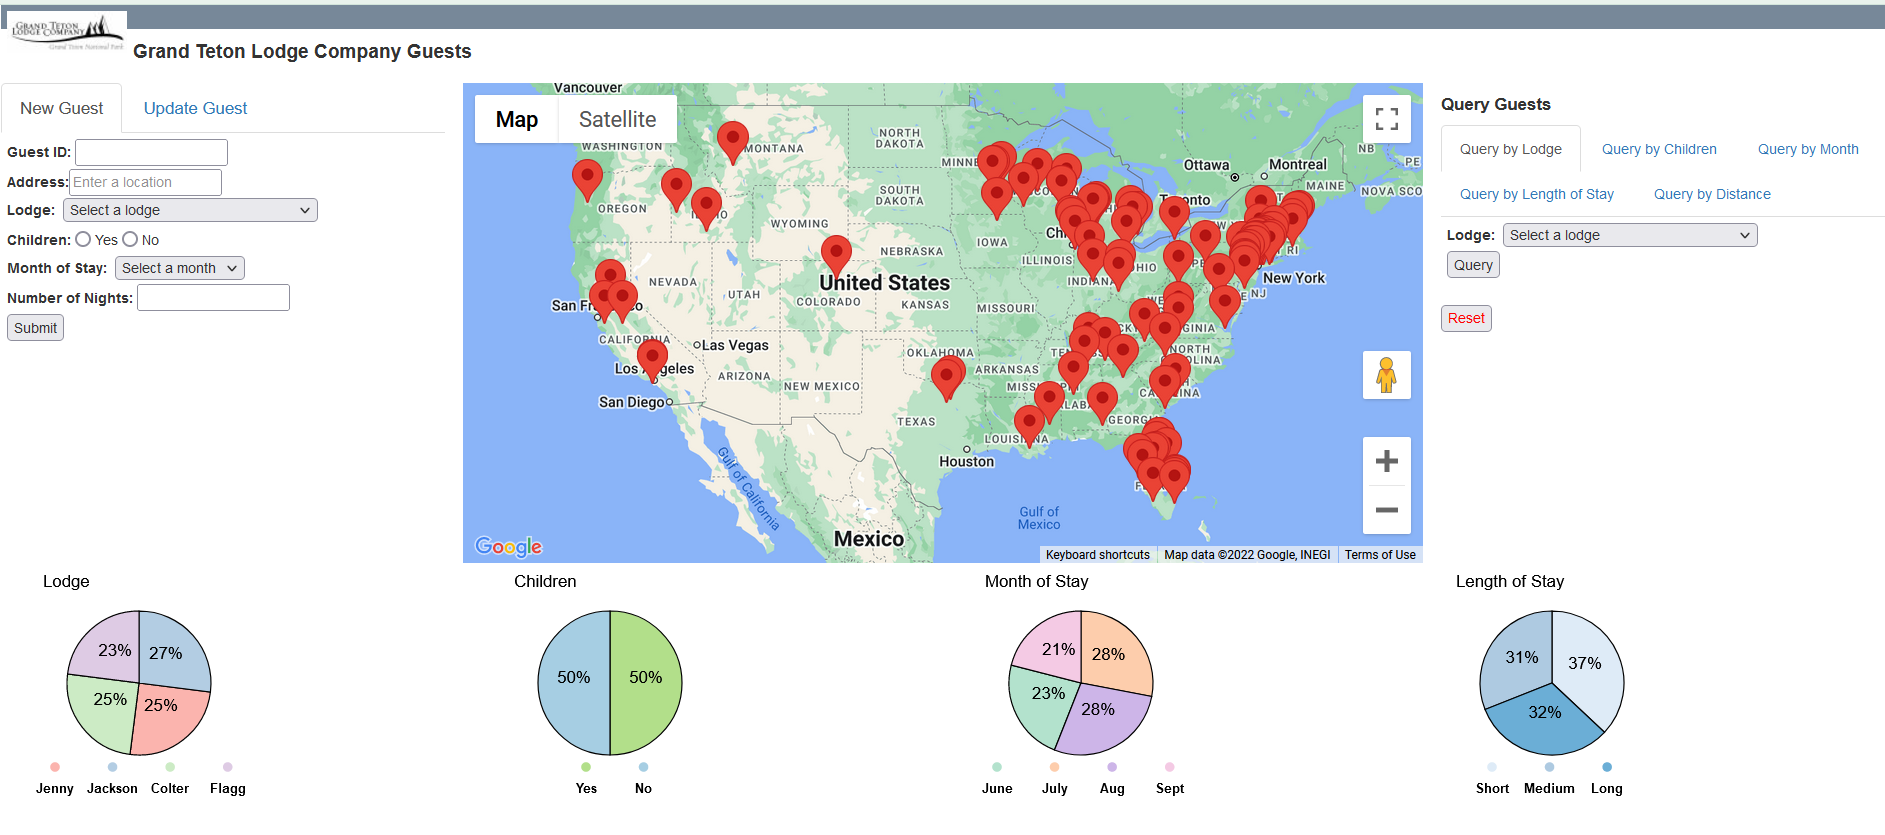
Tools: Google Maps Platform, D3, JavaScript, Java, PostgreSQL Database
Course: GEOG 576 - Geospatial Web and Mobile Programming (UW-Madison)
Project Background: The goal of the project was to create a web application with client-server communication to solve a problem. It was my first project involving both client-side and server-side development. I designed it for managers and the marketing teams of the Grand Teton Lodge Company to understand if there were patterns between where a guest originates from and their preferences while staying in the park. The guests data is stored in a table in a PostgreSQL database. From the client, the user can query which guests from the database to display in the map based on certain stay preferences (such as month of stay), add new guests into the database, and update the data for existing guests in the database. Based on the user interactions, HTTP GET & POST requests communicate with a Java JSP on the hosting server that then connects to the database and performs the necessary SQL query before returning the guests data for display in the map and pie charts on the client.
National Parks Annual Visitation Application
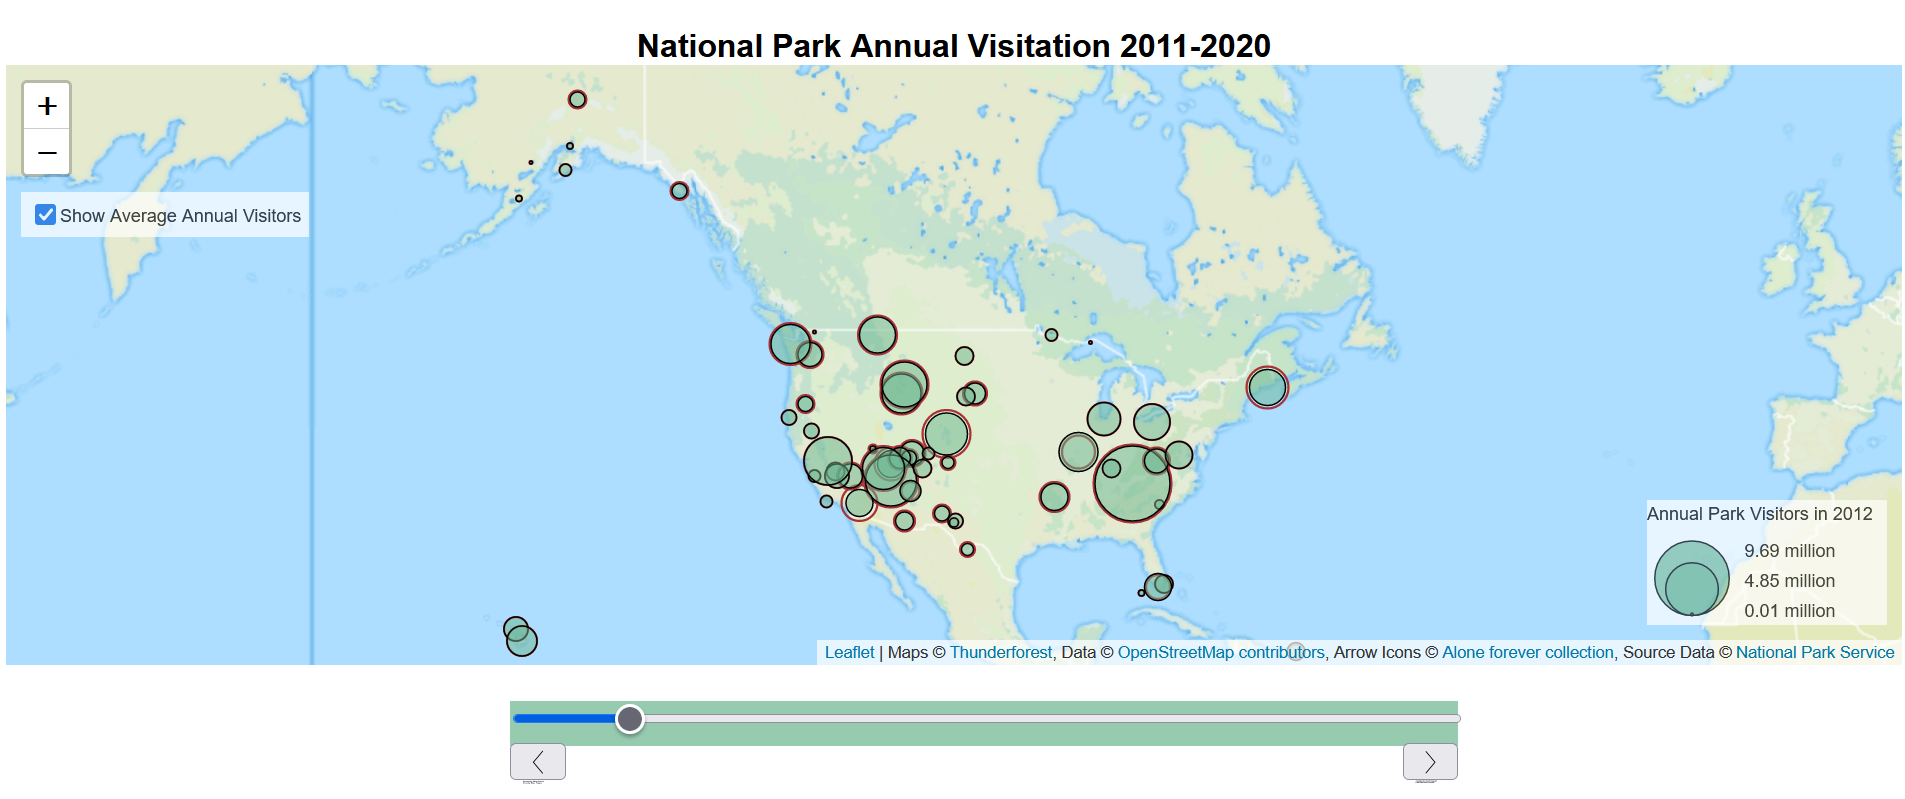
Tools: Leaflet, jQuery, JavaScript, GitHub
Course: GEOG 575 - Interactive Cartography & Geovisualization (UW-Madison)
Project Background: As my first project utilizing JavaScript, the goal was to design a web application with a thematic map and basic interaction operators to interact with the map. My project focused on comparing annual visitation at national parks from 2011 to 2020 with proportional point symbols sized according to annual visitation at each park. The application included the operators of zoom, pan, retrieve (popups of information for each point in the map), sequence (move through the years), and overlay (turning on an average visitation layer). The project was a great introduction to using JavaScript to develop an interactive map with basic functionality and operators.
National Parks Geodatabase
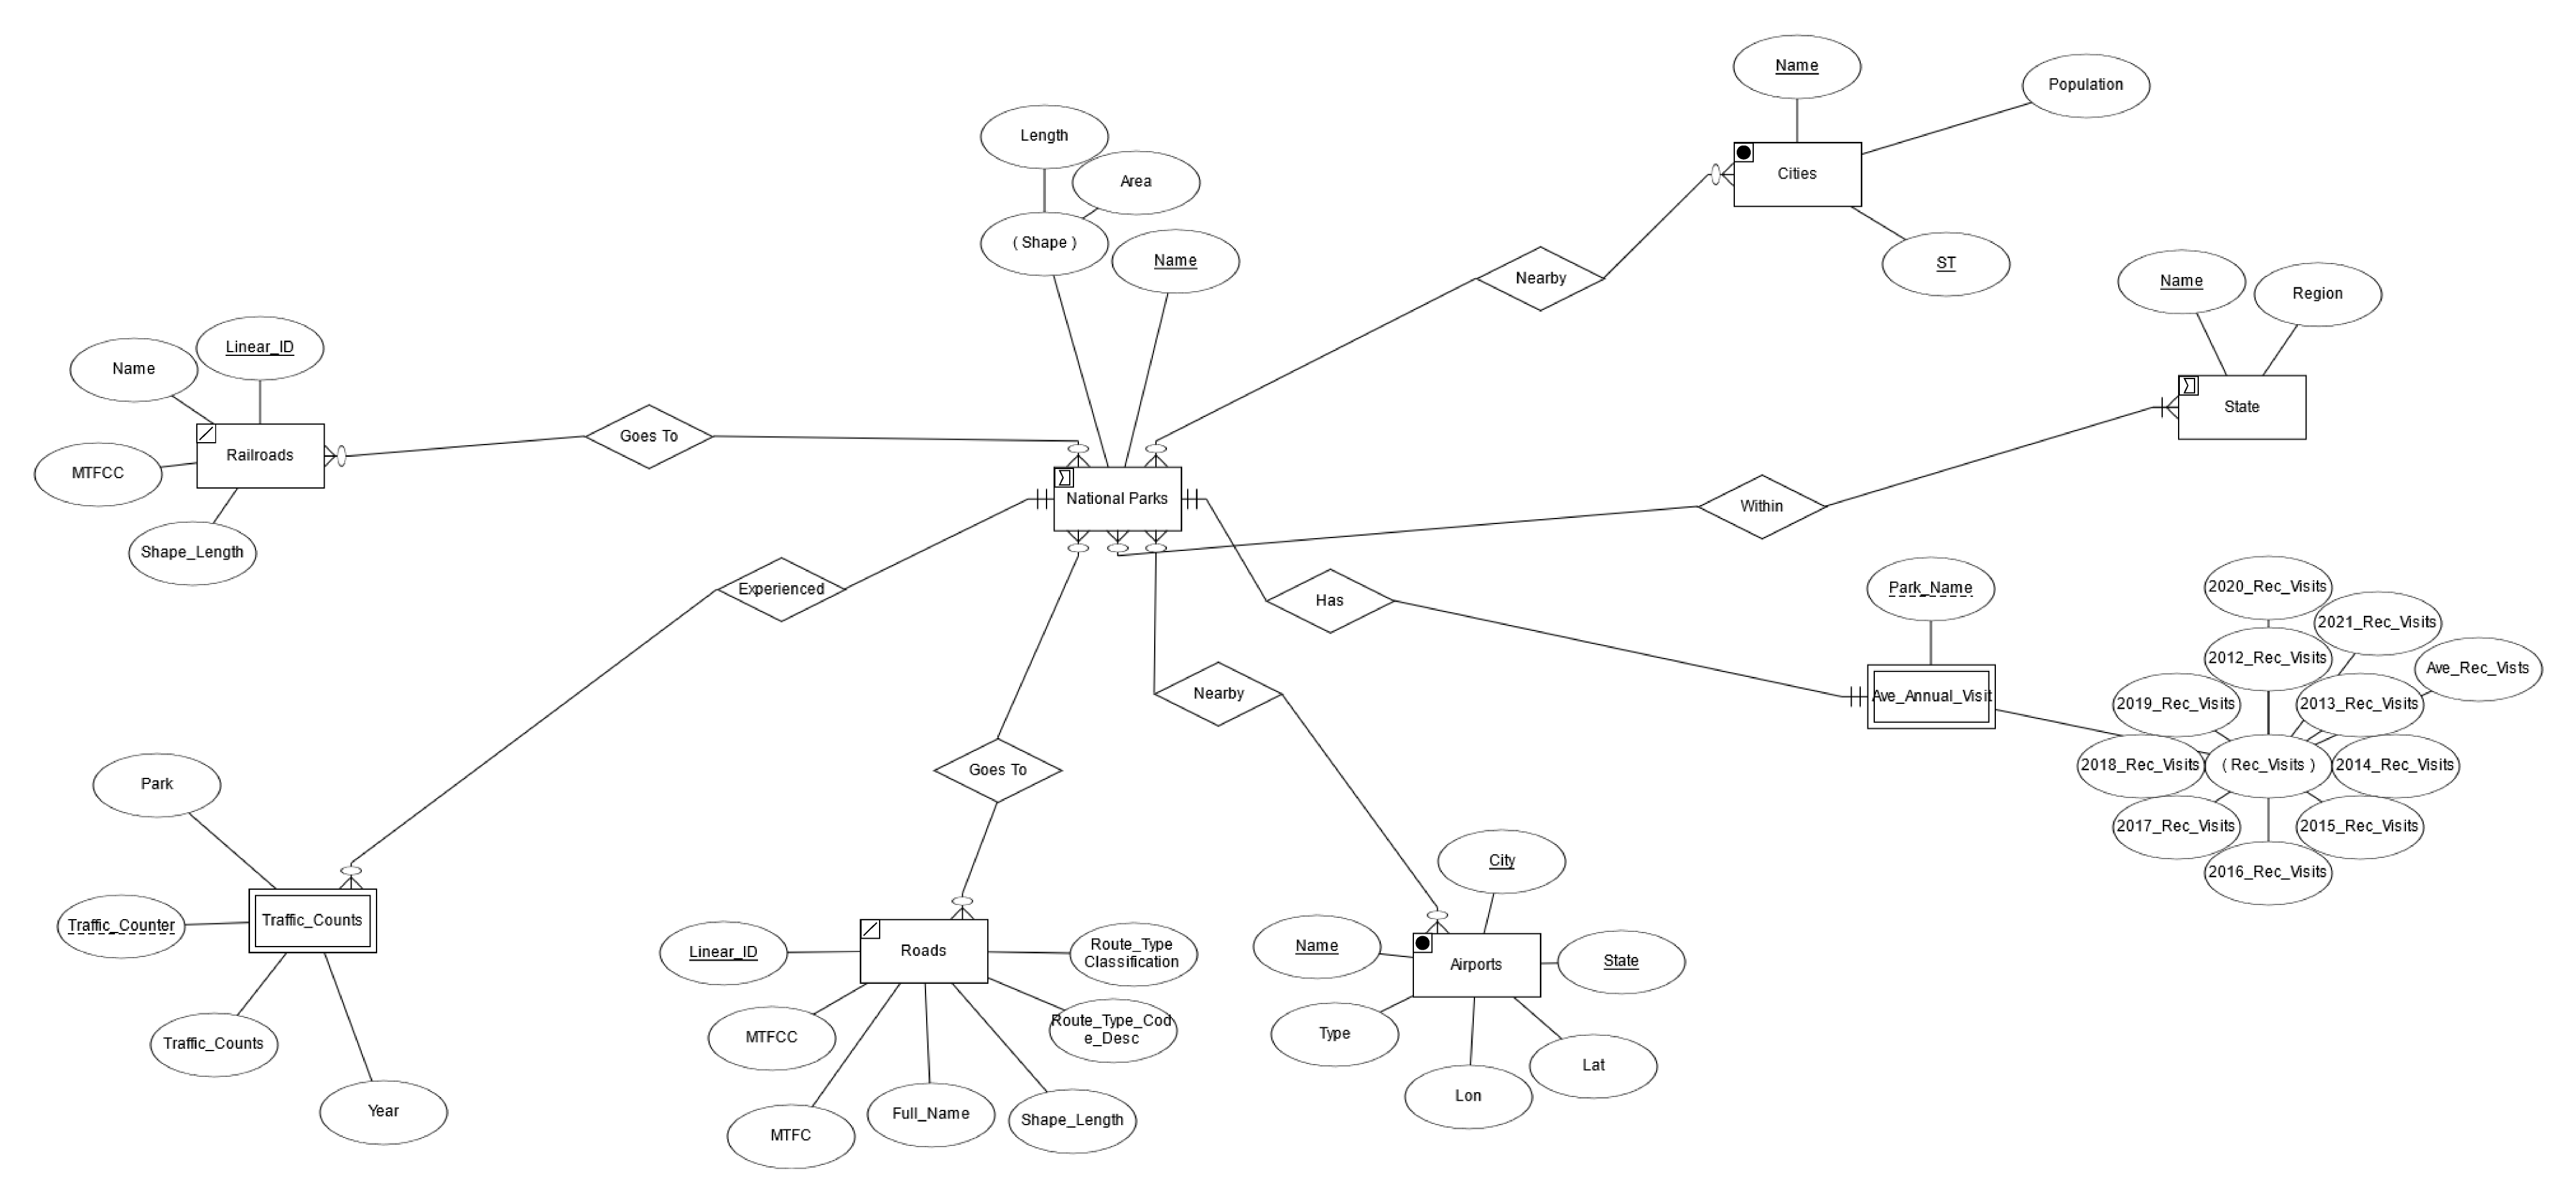
Tools: Esri Geodatabase, ArcGIS Pro
Course: GEOG 574 - Geospatial Database Design and Development (UW-Madison)
Project Background: The goal of this project was to design and implement a spatial database that could be manipulated to help explore and solve a spatial problem. My group chose to design a geodatabase in ArcGIS Pro to compare which national parks receive the most visitation and whether the nearby transportation networks or nearby population areas have any correlation with visitation. We used ER and Relational Diagrams to define the relationships and attributes between the different entities in the geodatabase during the design process and upon implementing the geodatabase, we manipulated it using various geoprocessing tools in ArcGIS Pro to begin to explore the problem listed above. It was my first time designing and implementing a database.
National Parks of the West Bike Race Map
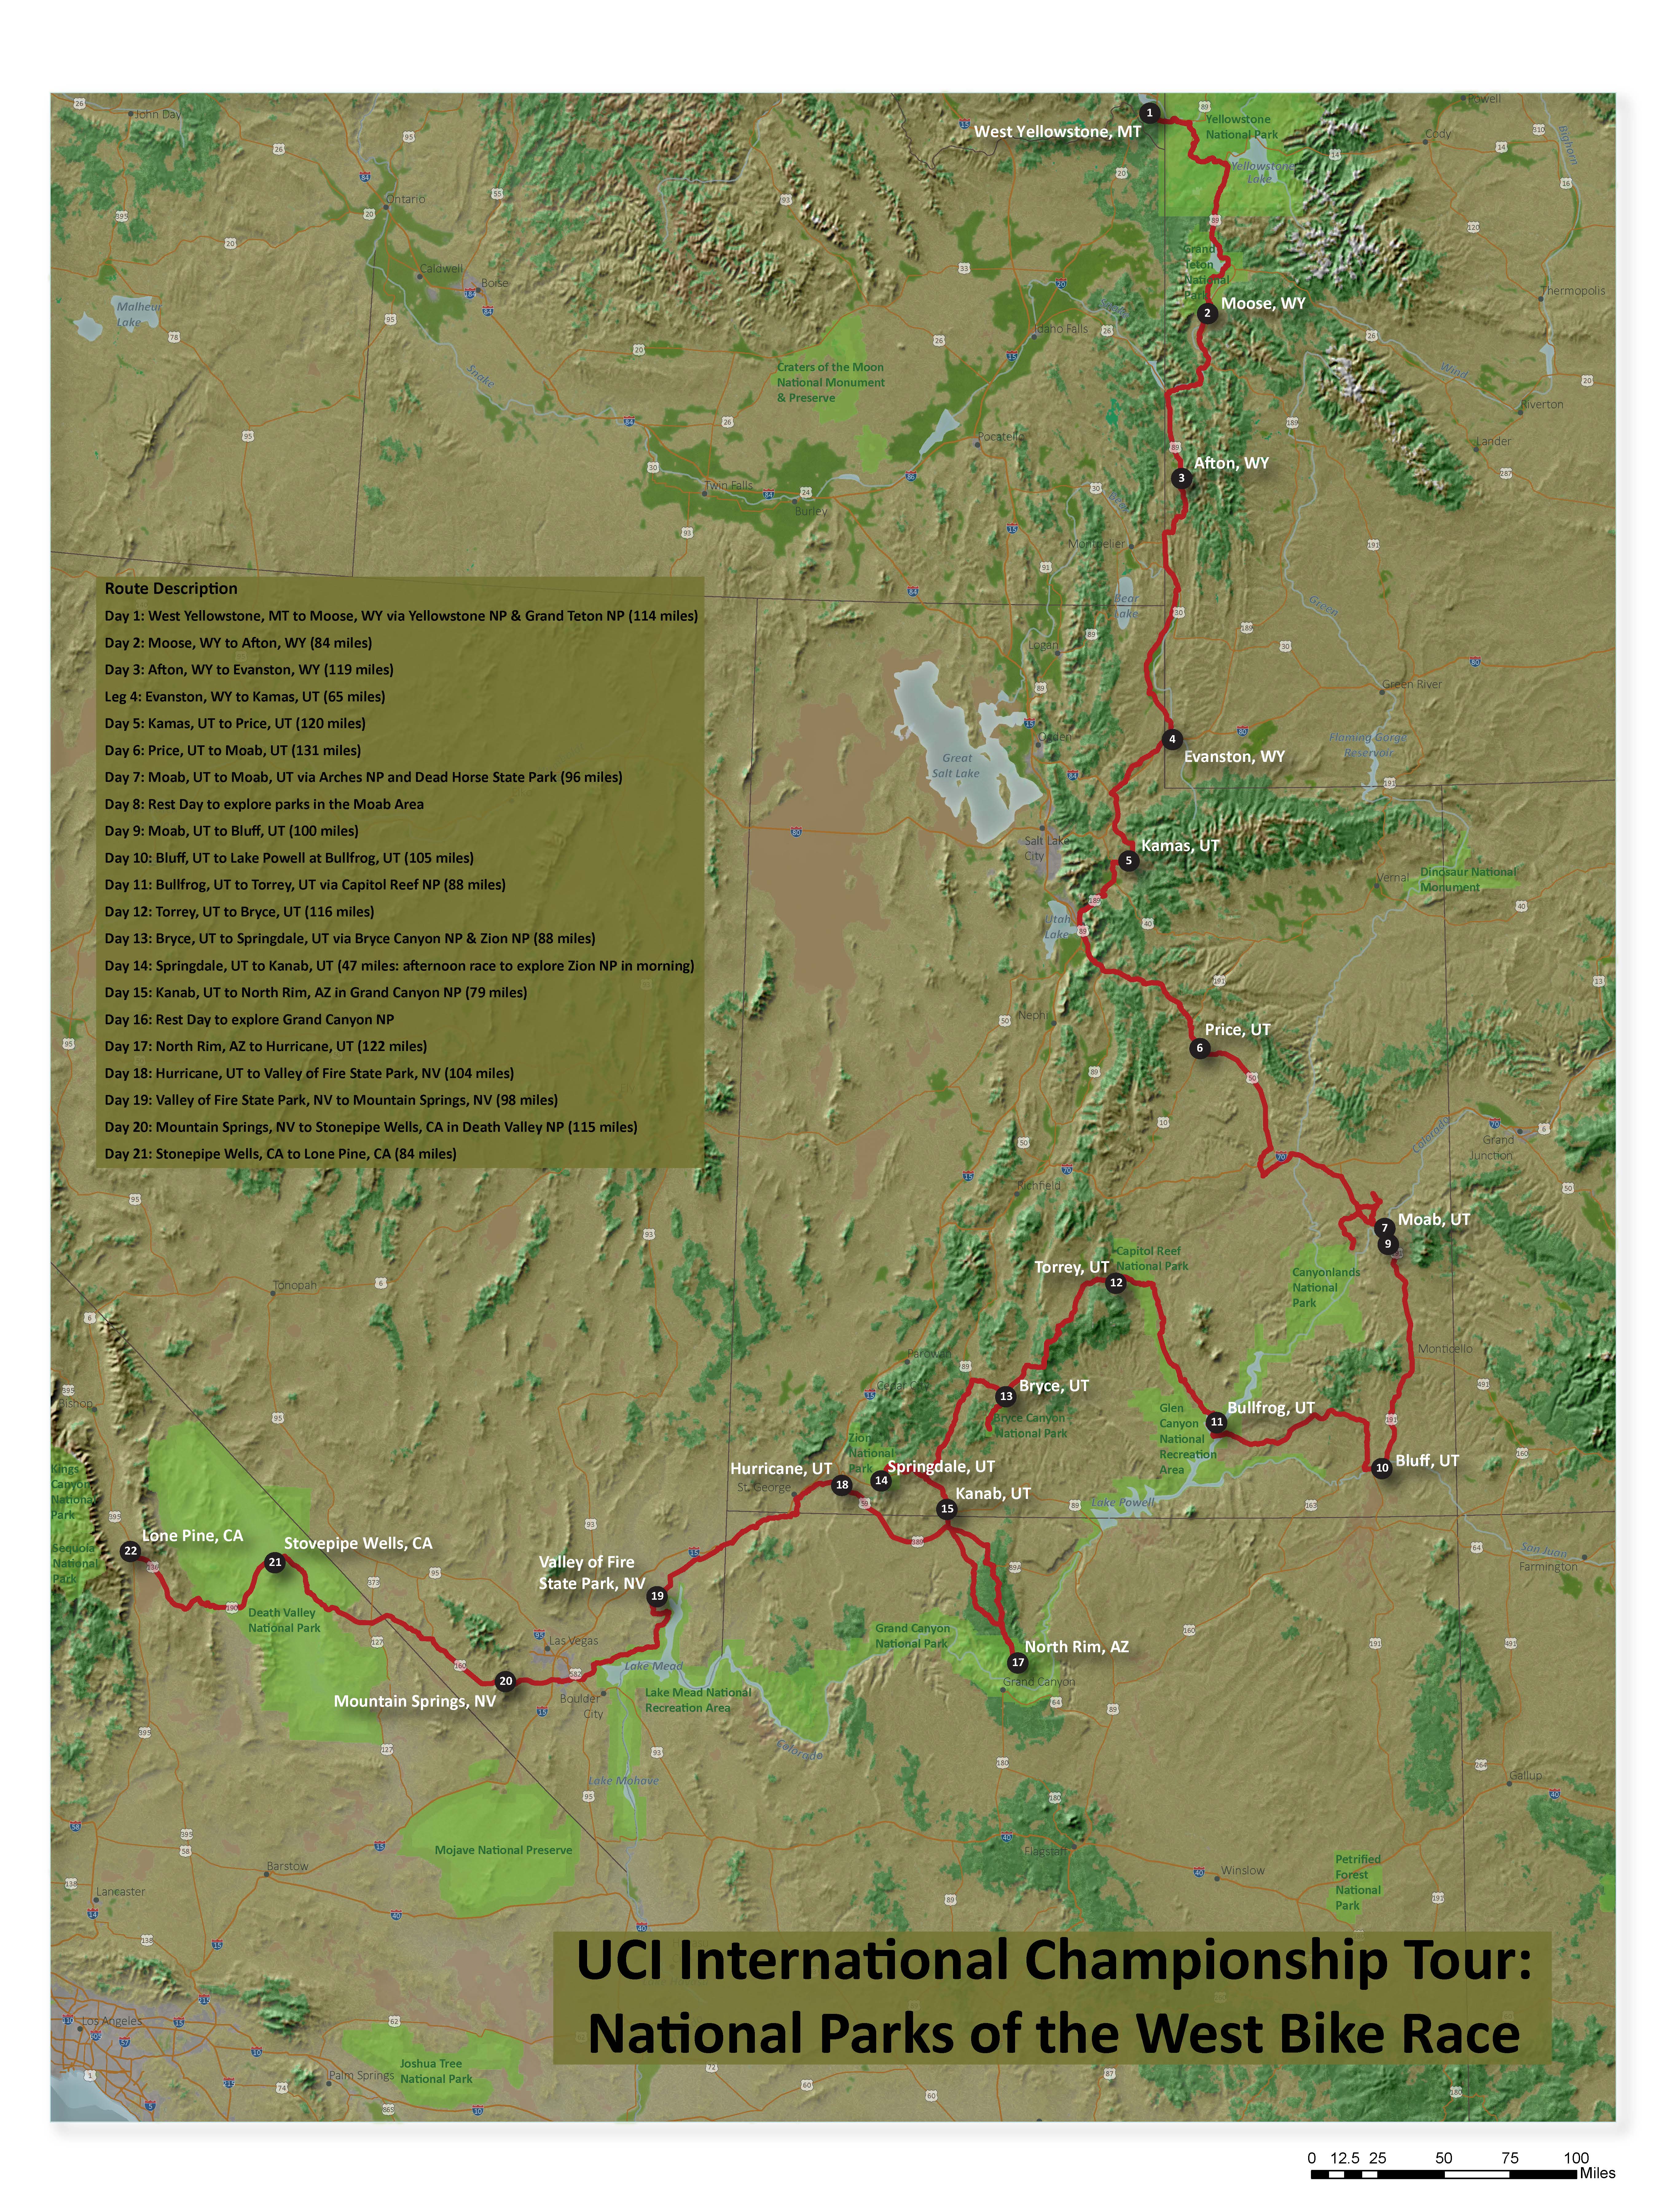
Tools: ArcGIS Pro, Adobe Photoshop & Illustrator
Course: GEOG 572 - Graphic Design in Cartography (UW-Madison)
Project Background: This project focused on creating a network flow map for a hypothetical bike race with a realistic relief technique used for the terrain. The overall goal was to apply the concept of visual hierarchy to have the reference map components fade to the background with the bike route standing out as the figure. The project involved working with both vector and raster data formats.
Soda Shops in Utah Application
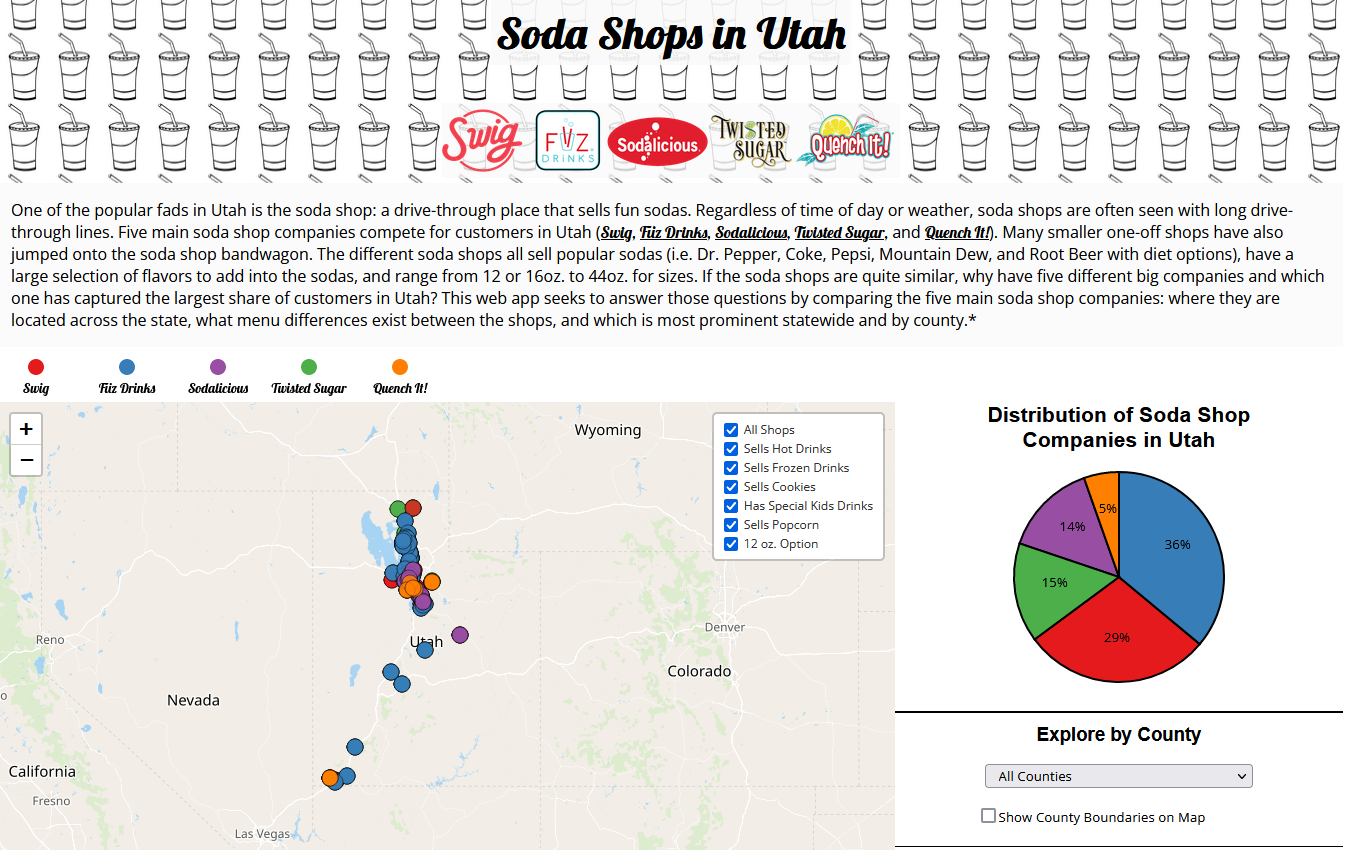
Tools: Leaflet, D3, JavaScript, jQuery, GitHub
Course: GEOG 575 - Interactive Cartography & Geovisualization (UW-Madison)
Project Background: As the final project of the course, the goal was to explore representation and interactive techniques for a topic of our choice. I designed the Soda Shops in Utah interactive web application to allow users to discover and learn more about the soda shop phenomenon in Utah through the use of popups of information for the shops in the map, filtering the map based on menu items, and a pie chart showing the proportion of shops. The user can choose to explore the data in the map and pie chart statewide or by selecting a county.
Tanzania Reference Map
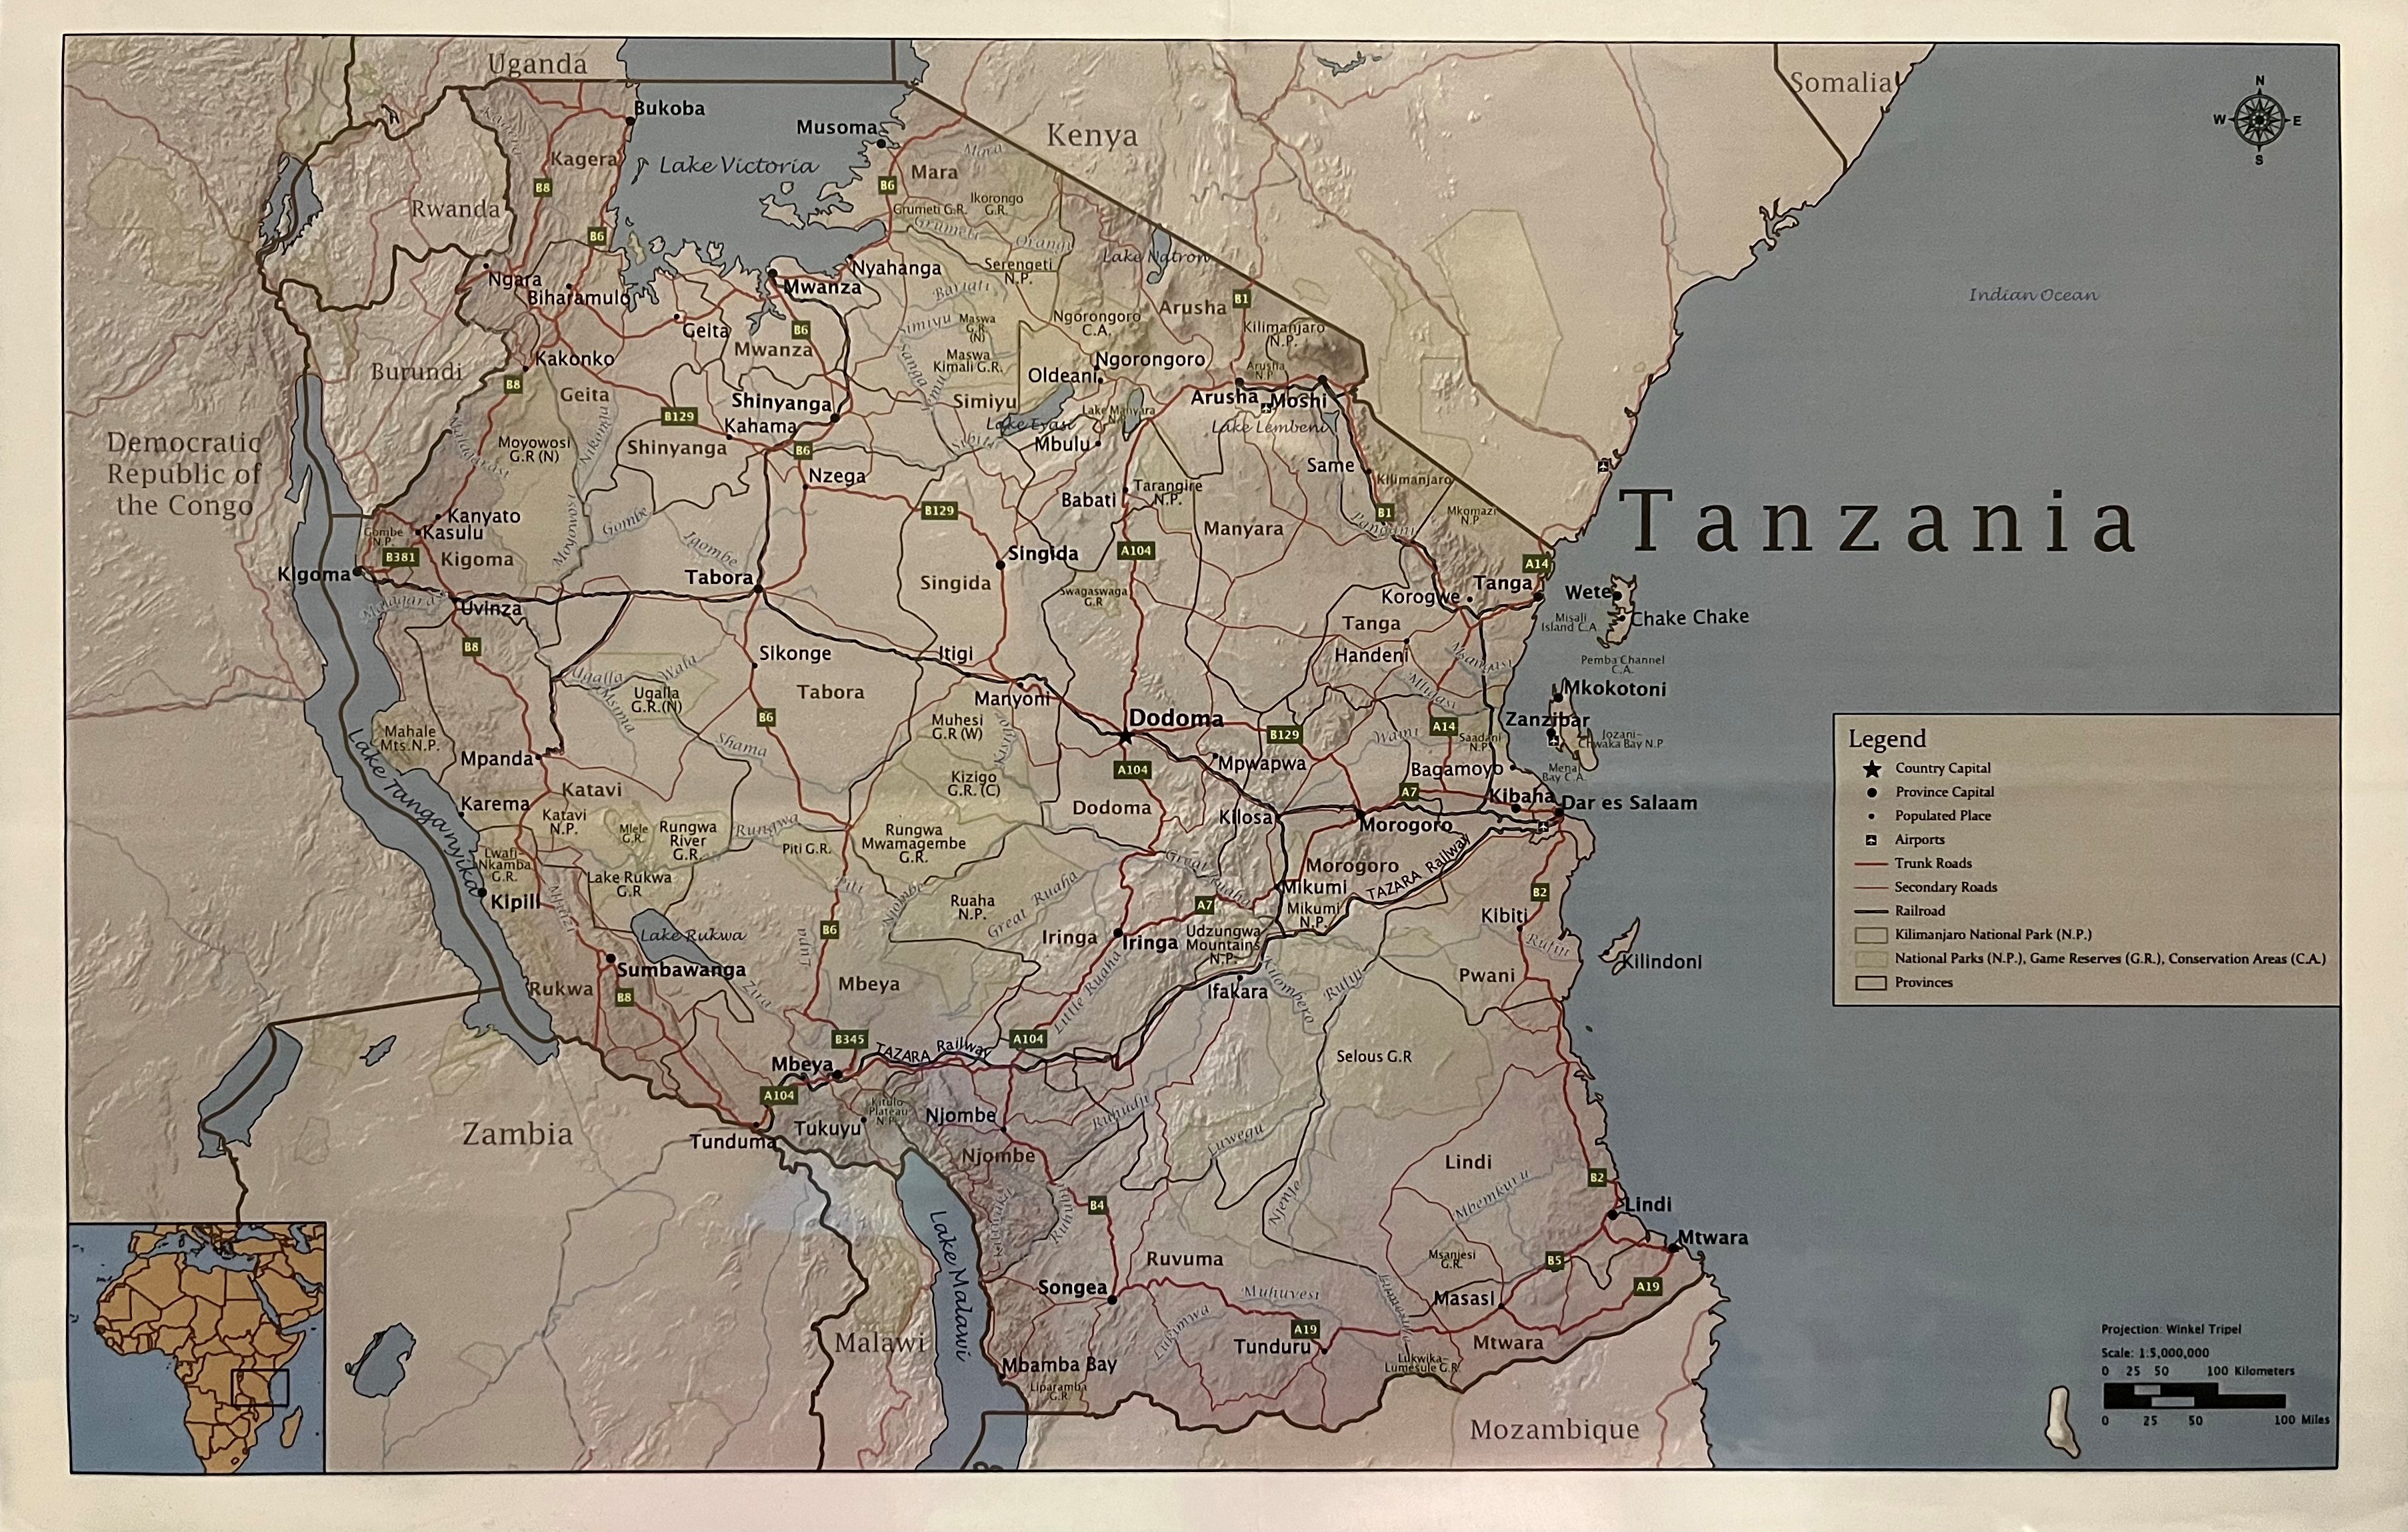
Tools: ArcGIS Pro
Course: GEOG 312 - Cartographic Design (BYU)
Project Background: In the course, we picked a place to design a reference map for and applied the cartographic design principles we were learning about, such as generalization and labeling, to the reference map as we went throughout the course to get practice with the principles. Having attended the study abroad to Tanzania, (see "About Me" section), I chose to design the reference map for Tanzania. This was my first cartographic design product.
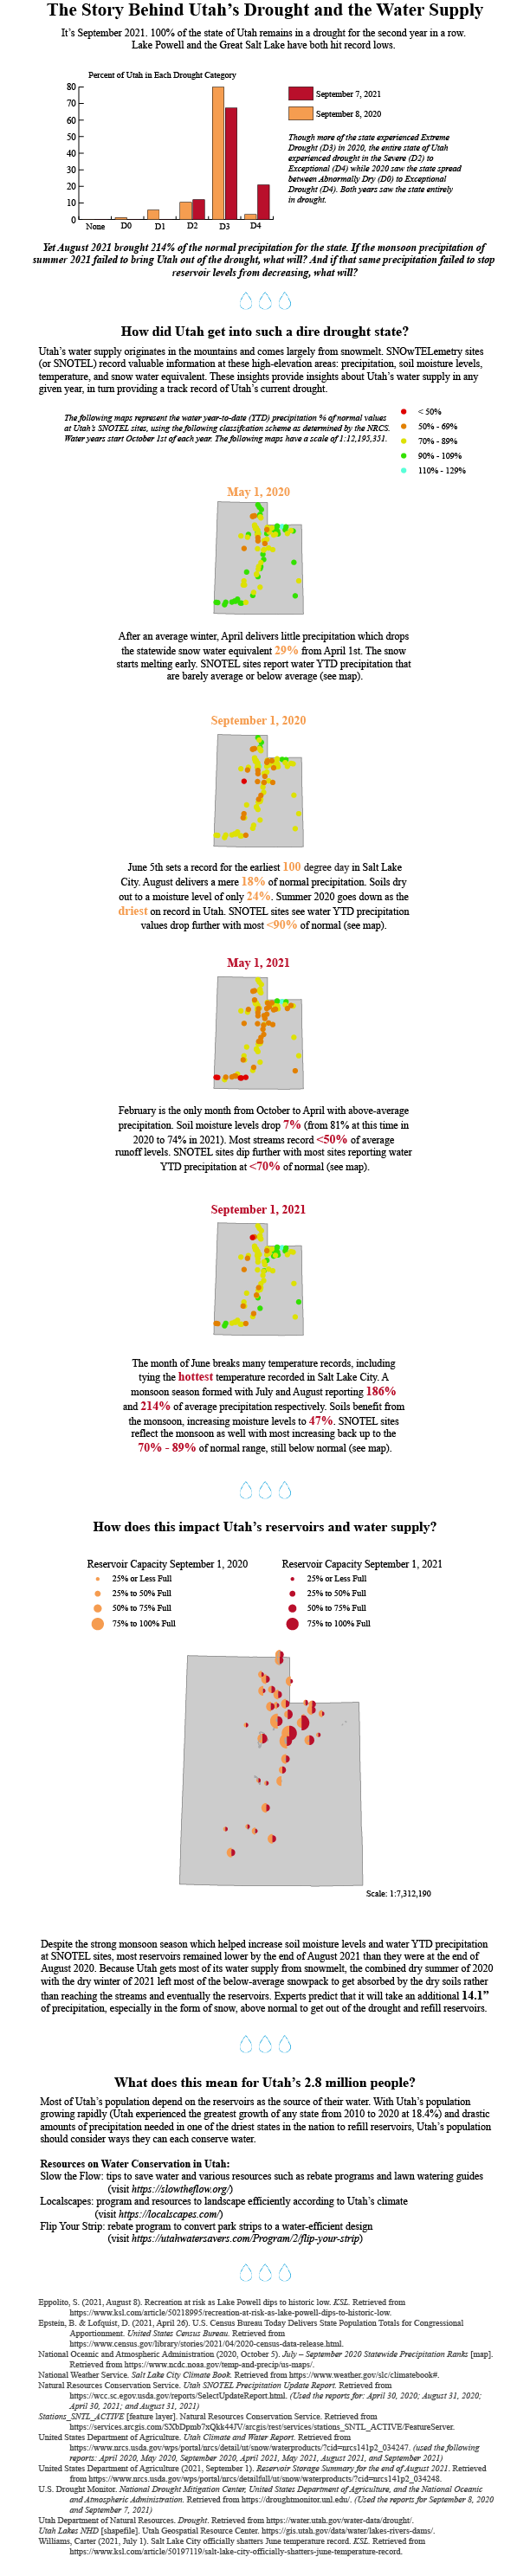
The Story Behind Utah's Drought & the Water Supply Infographic
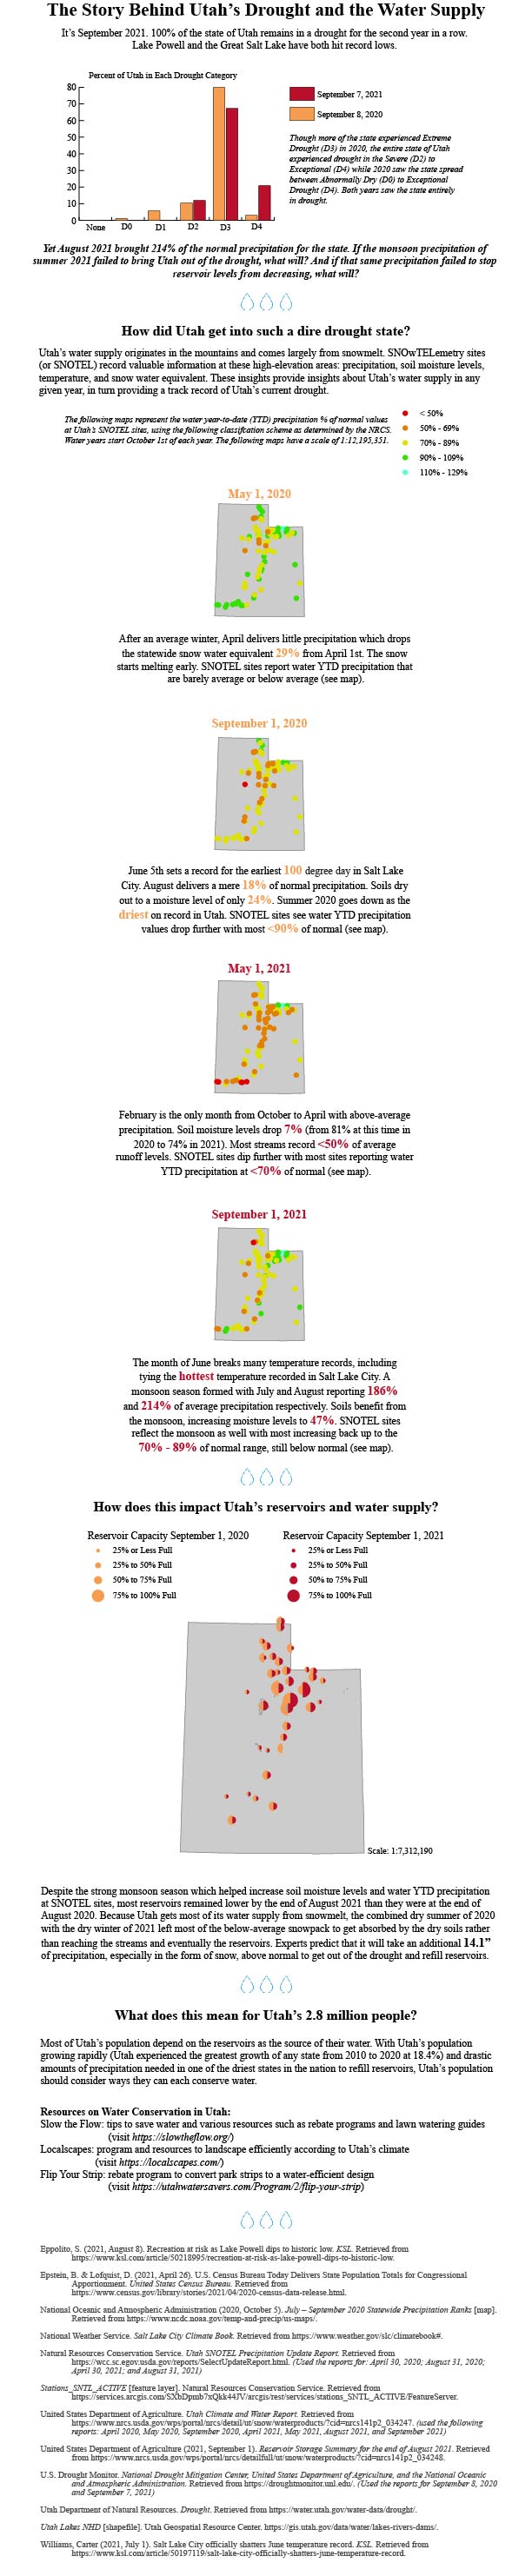
Tools: Adobe Illustrator, ArcGIS Pro
Course: GEOG 572 - Graphic Design in Cartography (UW-Madison)
Project Background: The goal was to practice visual storytelling in the form of a longform information graphic. Within the infographic, maps (including a bivariate split-symbol map) and other statistical graphics were used to help tell the story. My focus was on presenting the story of Utah's drought and the resulting water supply.
Professional Work
(in alphabetical order by title)
Automating Vector Tile Pack Updates Script
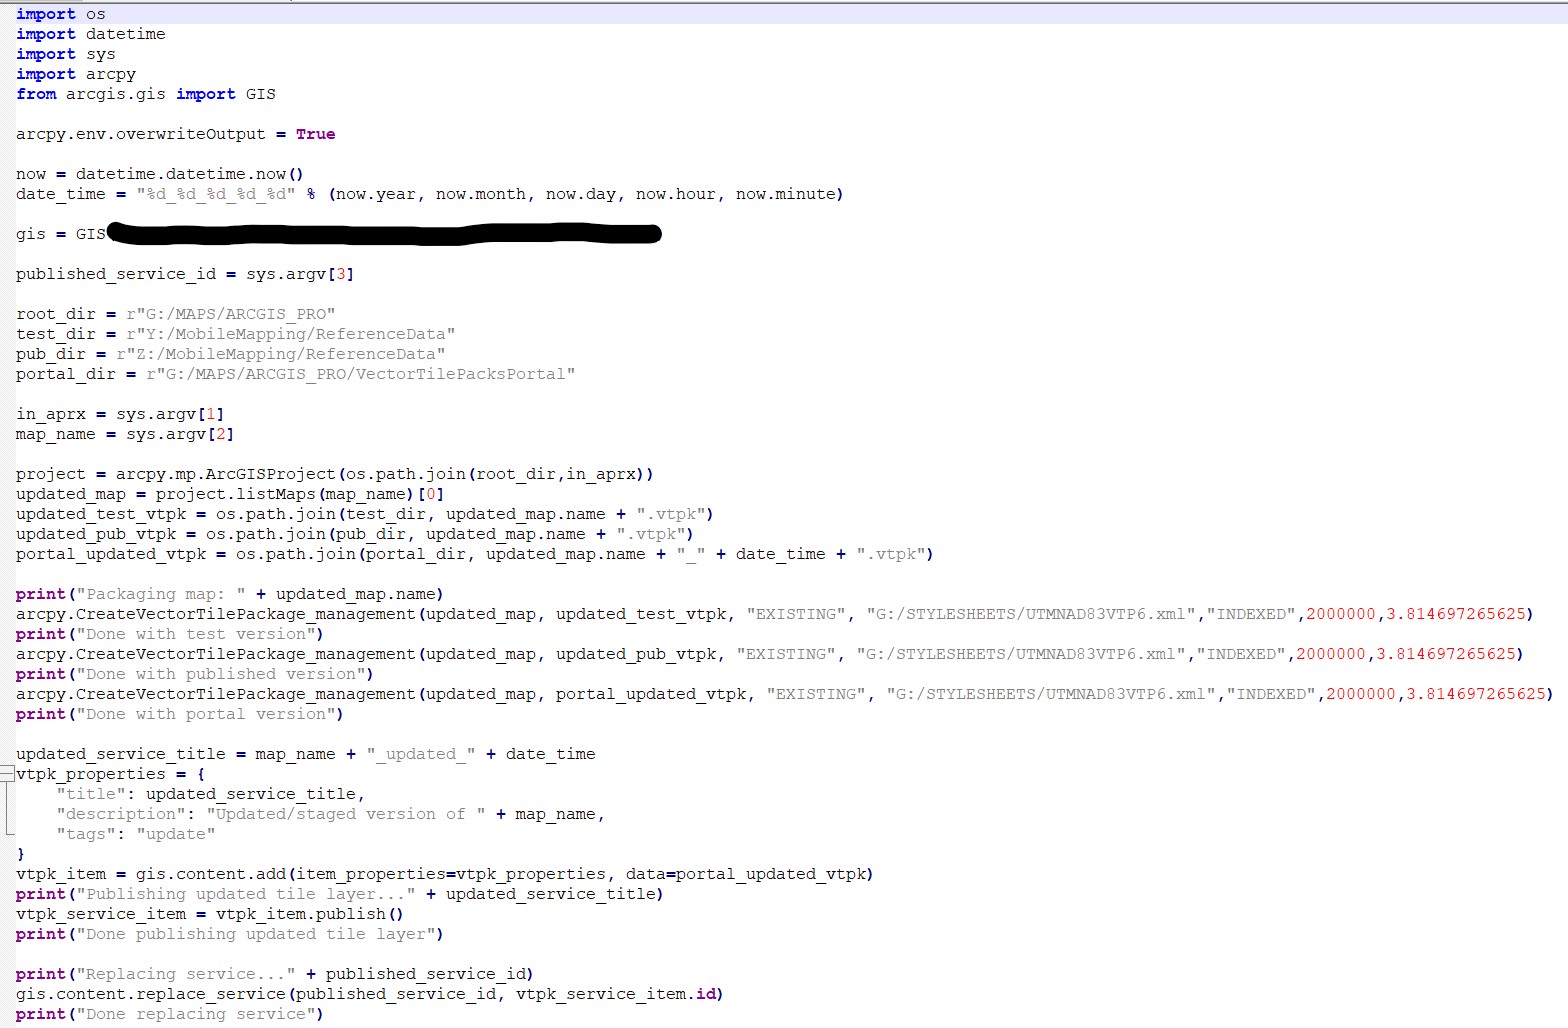
Tools: Python, Arcpy, ArcGIS API for Python
Project Background: One of the most tedious workflows we had at Central Utah Water Conservancy District (CUWCD) was the process of updating the vector tile packs on a monthly basis. Using the knowledge I had learned of python, I was able to adapt existing python scripts to completely automate the process and only required entering in a few parameters in the command line to run, rather than the 1-2 days of manual effort it used to take to complete that process. Note: The code screenshot is the basic code for the process. The actual code includes looping through a list of the existing vector tile packs that fills in the parameters in the script for each one. It also includes error handling so that if one fails a message prints to the command line and the script continues to cycle through the rest of the list.
Reservoir Peaks Split Symbol Map
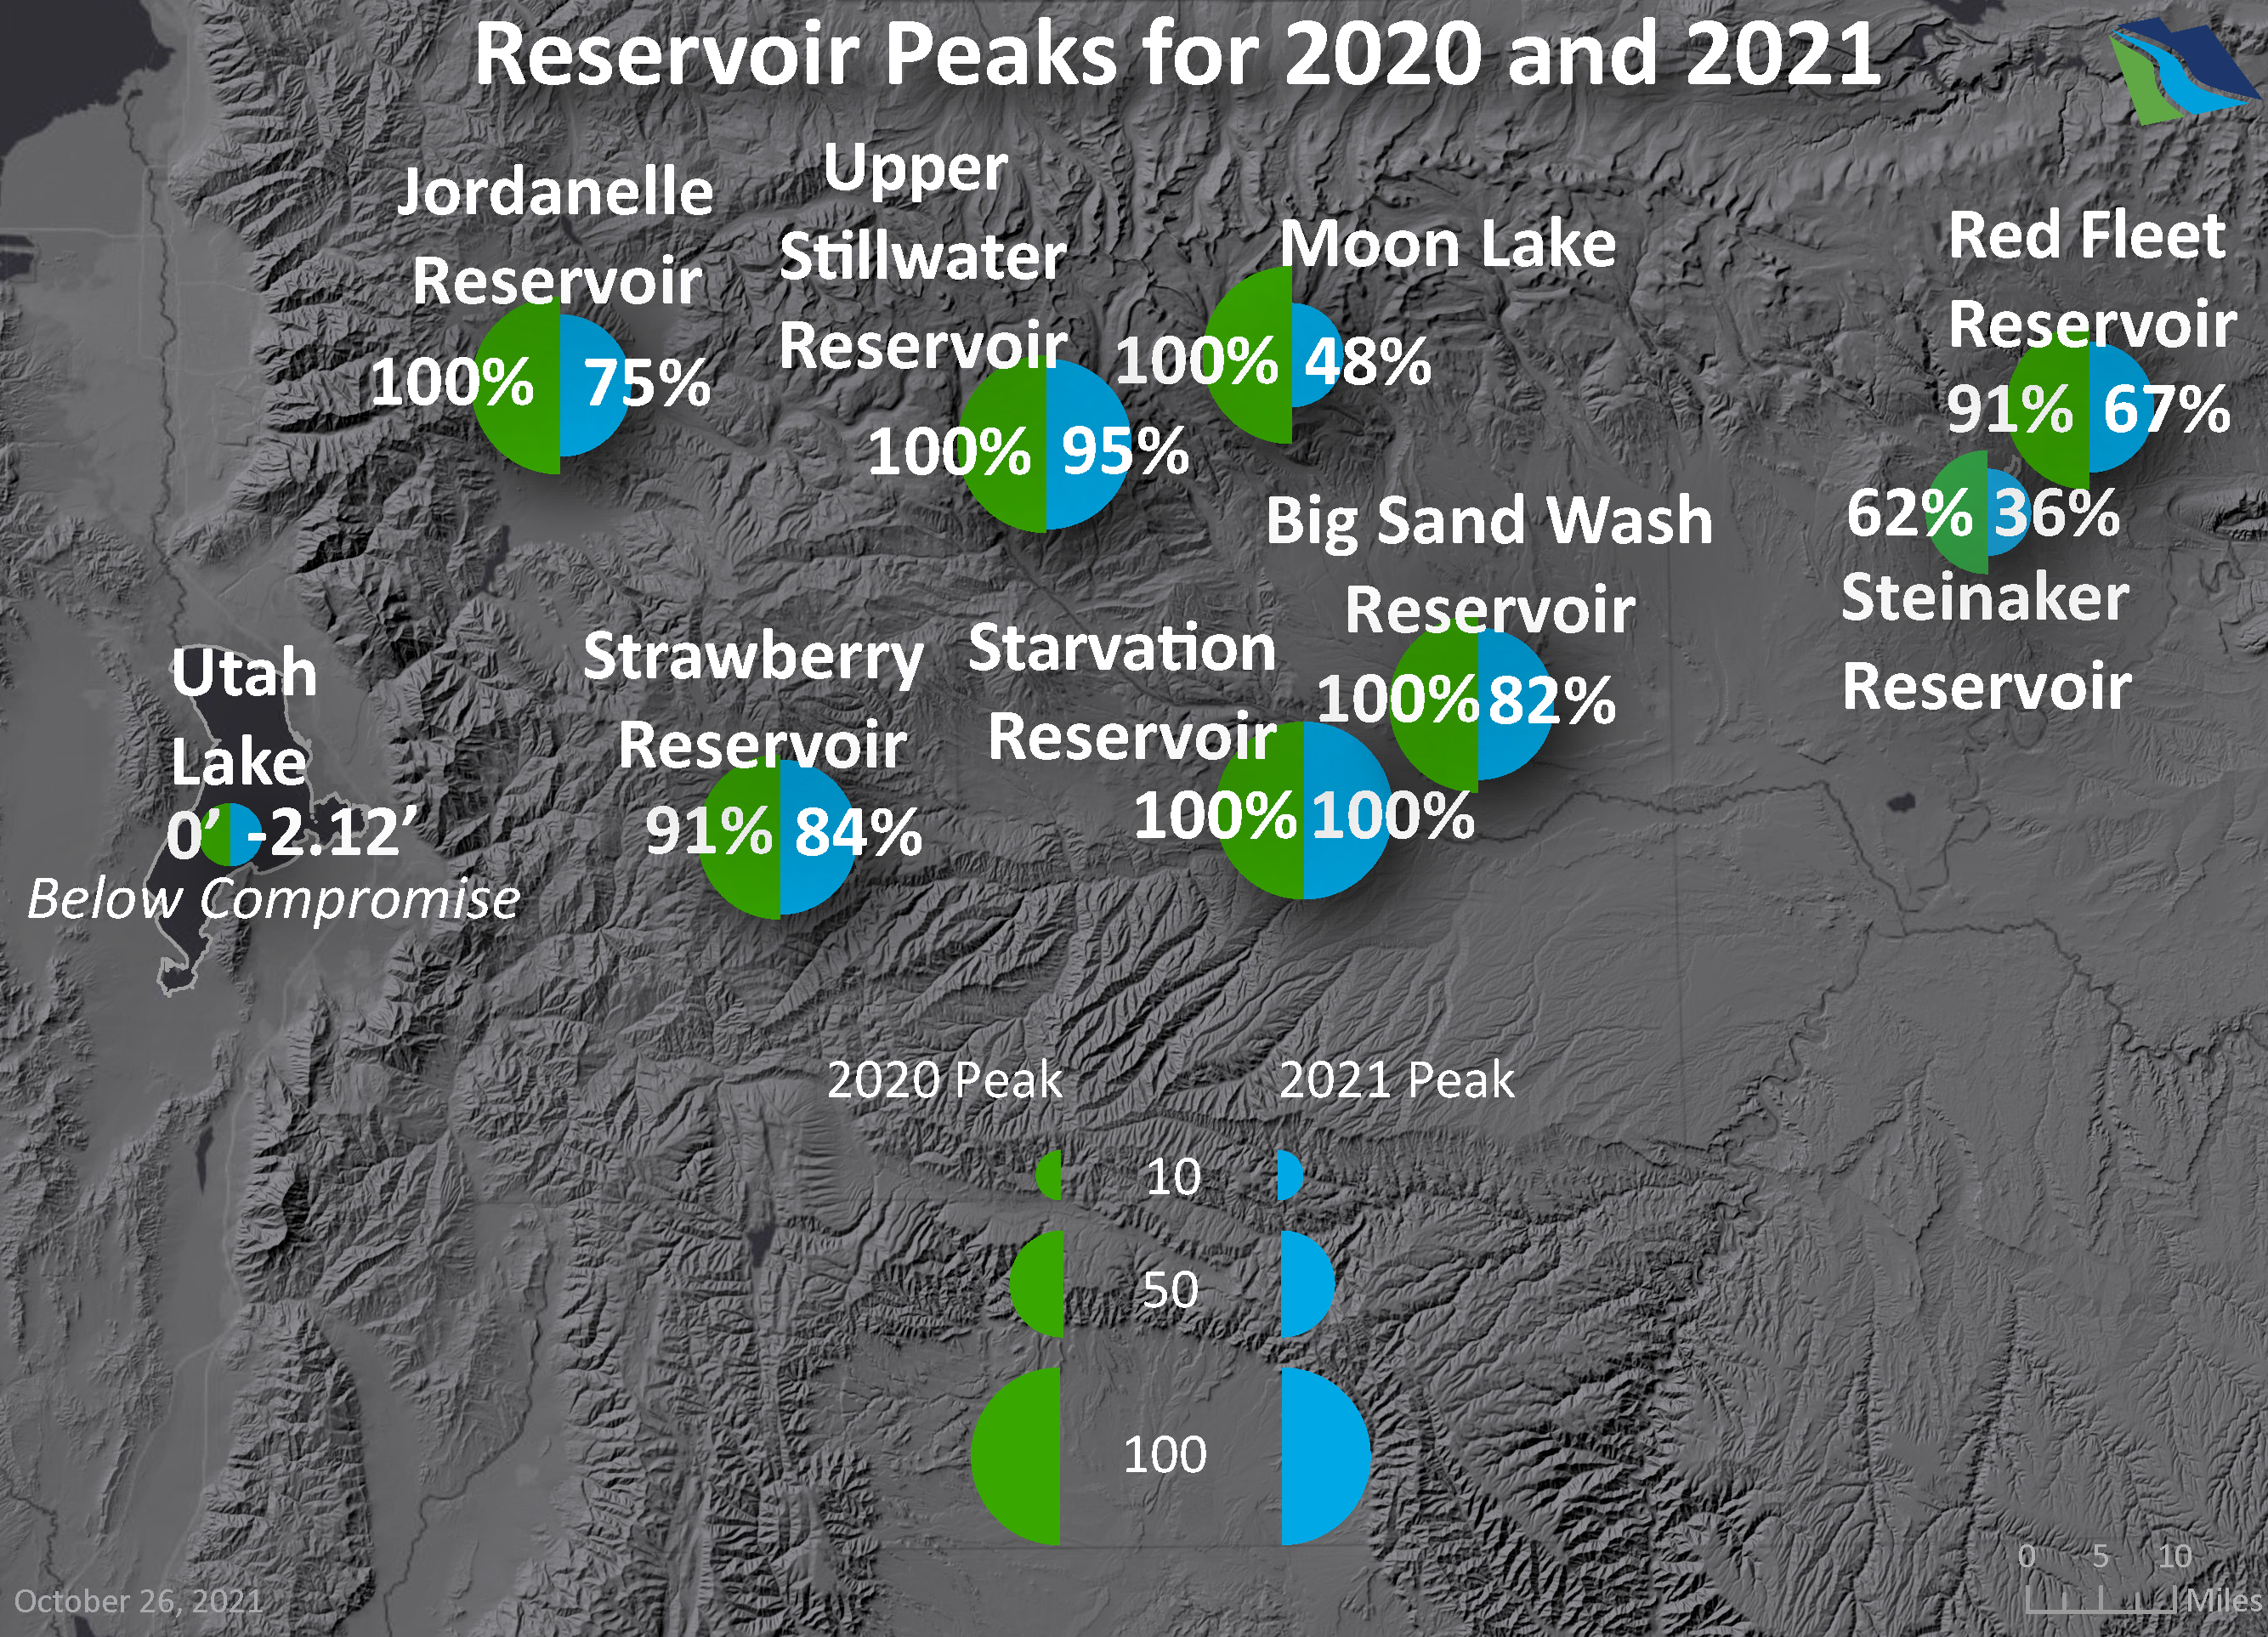
Tools: ArcGIS Pro, Adobe Illustrator
Project Background: I created the above split symbol map for a presentation comparing 2020 and 2021 reservoir peaks. Since I created the presentation for the board of directors, I needed to design it in a way that presented the information powerfully yet simply. Using the split symbol technique achieved both of those goals as the split symbols made it easy to compare the two years and convey the story of the lower reservoirs in 2021.
Tolkien-Themed District Map
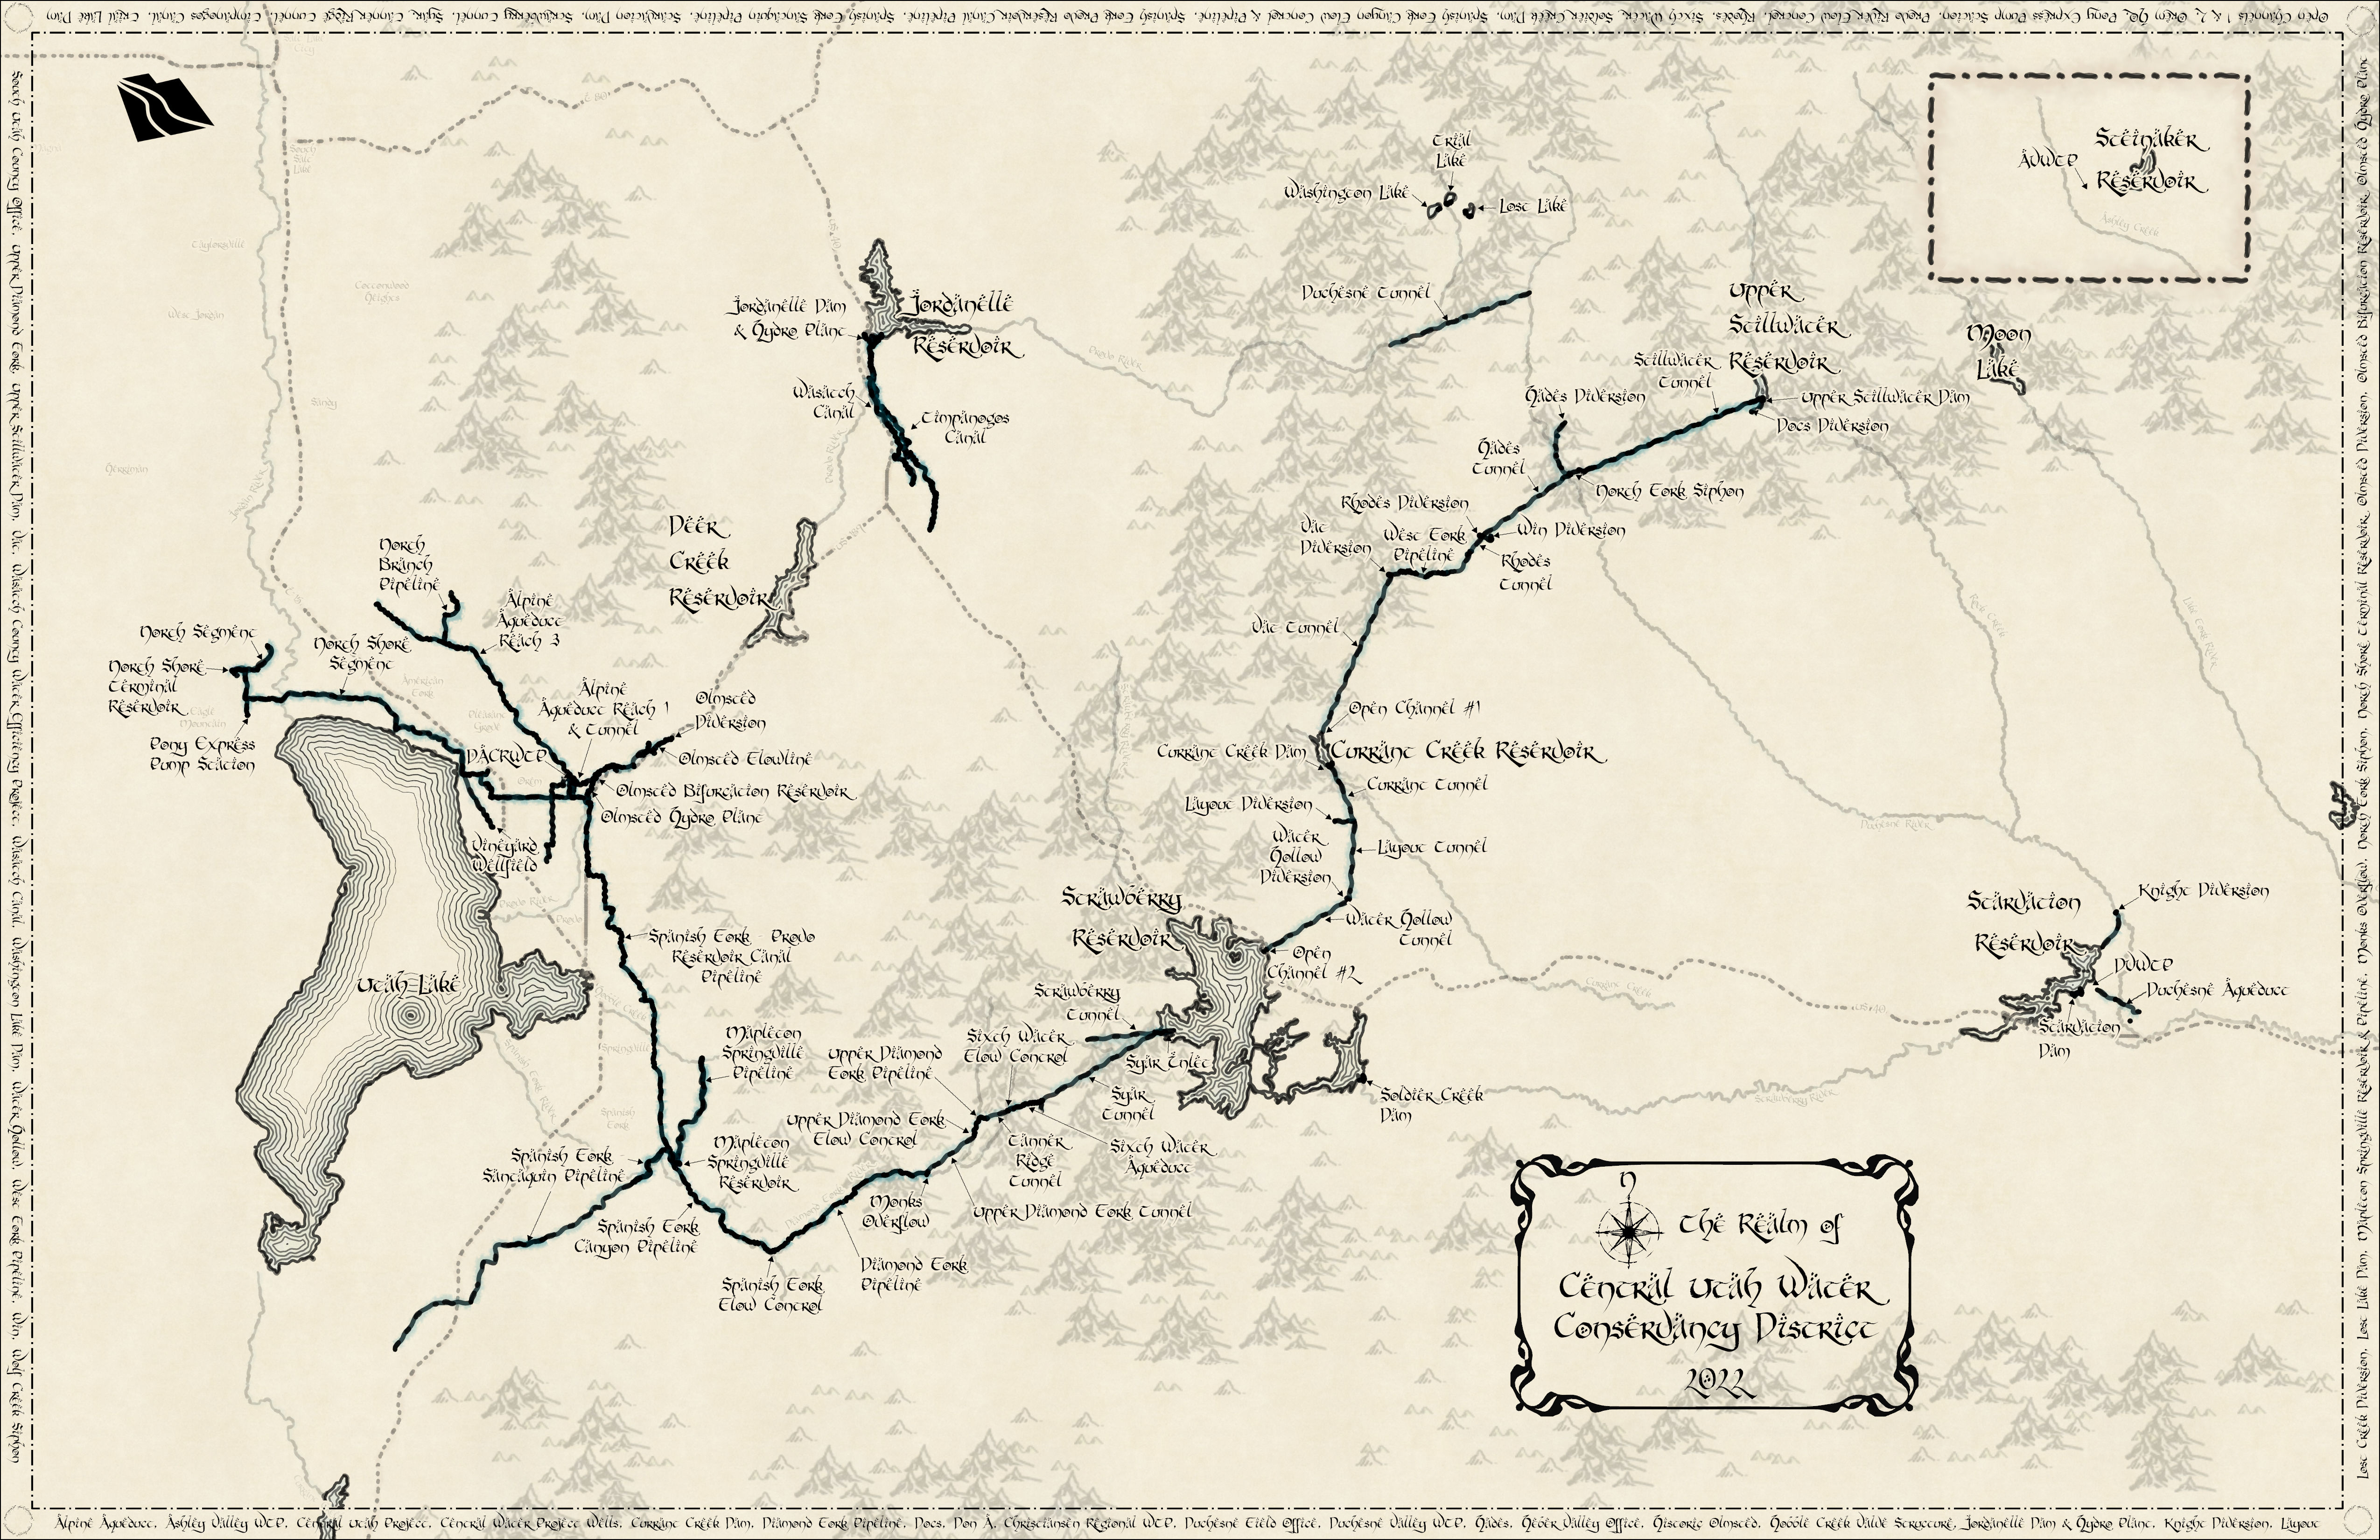
Tools: ArcGIS Pro
Project Background: At CUWCD, we recently updated the District maps. One of the more interesting ones I got to be involved with was applying a fun Tolkien-style theme to the basic map for display on canvas in the break room. I had to apply various cartographic principles to ensure it matched the theme, while still conveying the intended information.
Utah Lake Map
Tools: ArcGIS Pro
Project Background: I created the above map for another department to be a basic reference map showing places of interest for Utah Lake. I often have the opportunity to work with other departments at CUWCD to create a wide range of maps. Doing so has given me a great opportunity to coordinate with others to create maps that best fit their needs.
Water Supply Update Story Map
Tools: ArcGIS StoryMaps, ArcGIS Online
Project Background: One of the main things I have done while employed with CUWCD has been pioneering converting the Water Supply Update presentations given at board meetings from PowerPoints to ArcGIS StoryMaps. I am grateful for the opportunity I have had to pioneer this effort and set the stage for future presentations. To see some of the StoryMap presentations, visit this link and view any of the Water Supply Updates.
WCWEP Fields Application
Tools: ArcGIS Maps SDK for JavaScript, Bootstrap, GitLab, ArcGIS Enterprise Server
Project Background: I am currently in the process of developing and designing a web map application for the general public to receive ticket information for a field. The field can be selected directly in a map or searched for using custom search sources (address, field number, or field owner) in the Search widgets, allowing users to find the needed field in the way that works best for them. The field information for the selected field displays in a panel with a linked PDF for the users to print the ticket information. All of the data is stored in an SDE on the CUWCD ArcGIS Enterprise Server. I am utilizing Bootstrap to ensure that the application works well for many screen sizes.
Experience
Education
- Master of Science in GIS Development, University of Wisconsin-Madison, September 2021 - May 2023
- Bachelor of Science in Geography, Brigham Young University, August 2016 - April 2020
Employment
- GIS Technician, Central Utah Water Conservancy District, July 2020 - Current
- GIS Intern, Central Utah Water Conservancy District, March 2019 - July 2020
Skills
- Geographic Information Systems & Cartography
- Development & Databases
- Adobe Creative Suite & Microsoft Office